Fig. 13
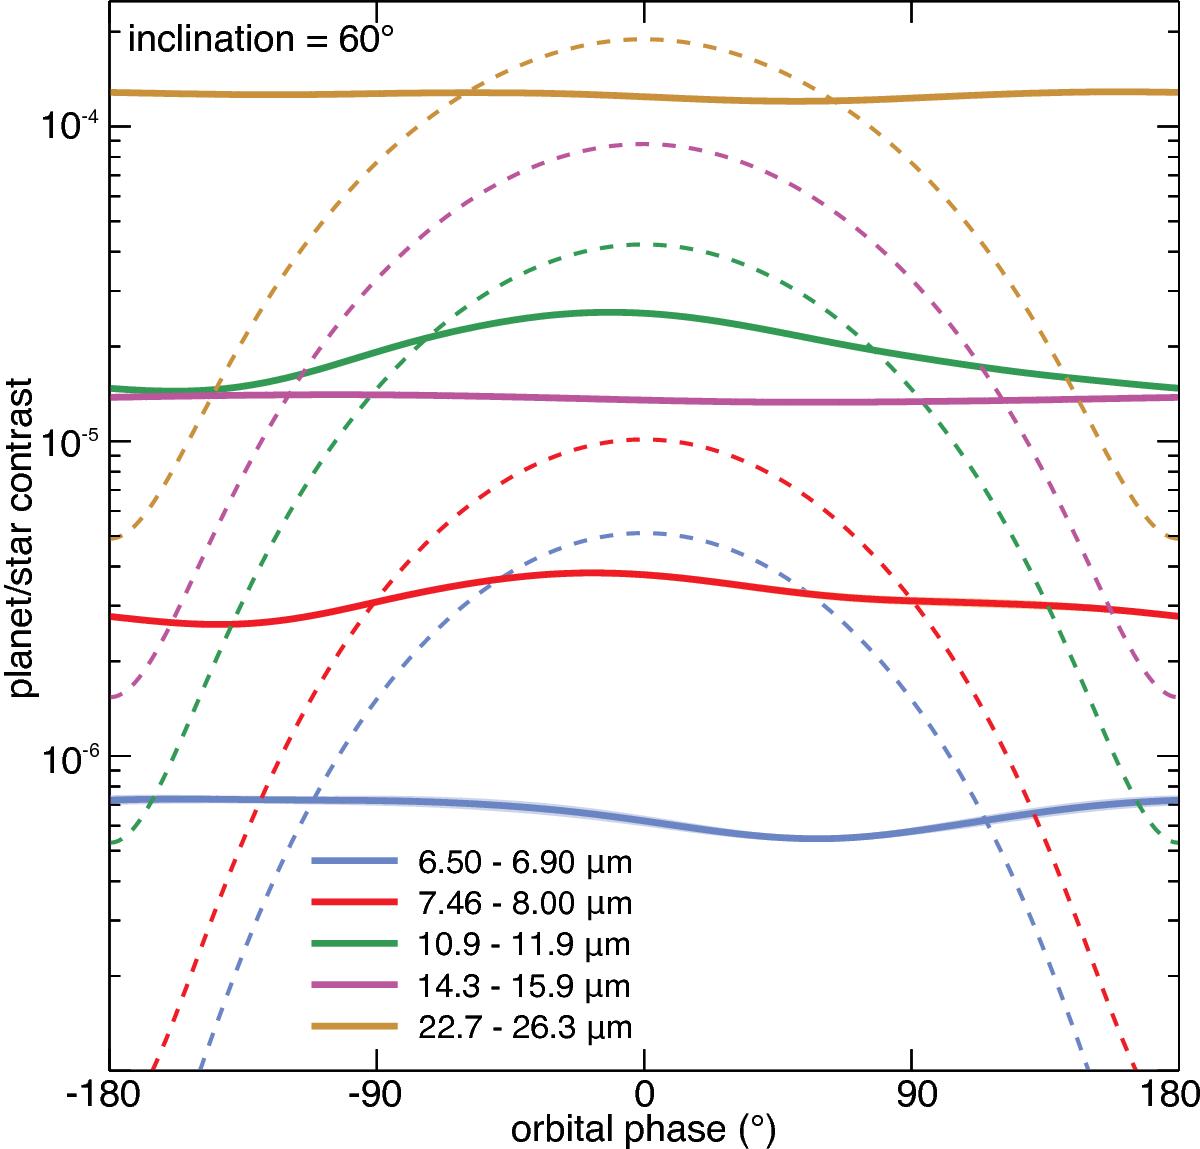
Emission phase curves computed for the synchronous case with an Earth-like atmosphere, for 4 spectral bands used in the GCM. Gray areas indicate the 1-sigma variability due to meteorology (mainly changing cloudiness). Dashed curves are calculated for a planet with no atmosphere with a constant surface albedo of 0.2. Contrary to Fig. 12, these plots include a dependency of the planetary radius on the inclination of R ∝ (M/sini)0.27.
Current usage metrics show cumulative count of Article Views (full-text article views including HTML views, PDF and ePub downloads, according to the available data) and Abstracts Views on Vision4Press platform.
Data correspond to usage on the plateform after 2015. The current usage metrics is available 48-96 hours after online publication and is updated daily on week days.
Initial download of the metrics may take a while.