Fig. 4
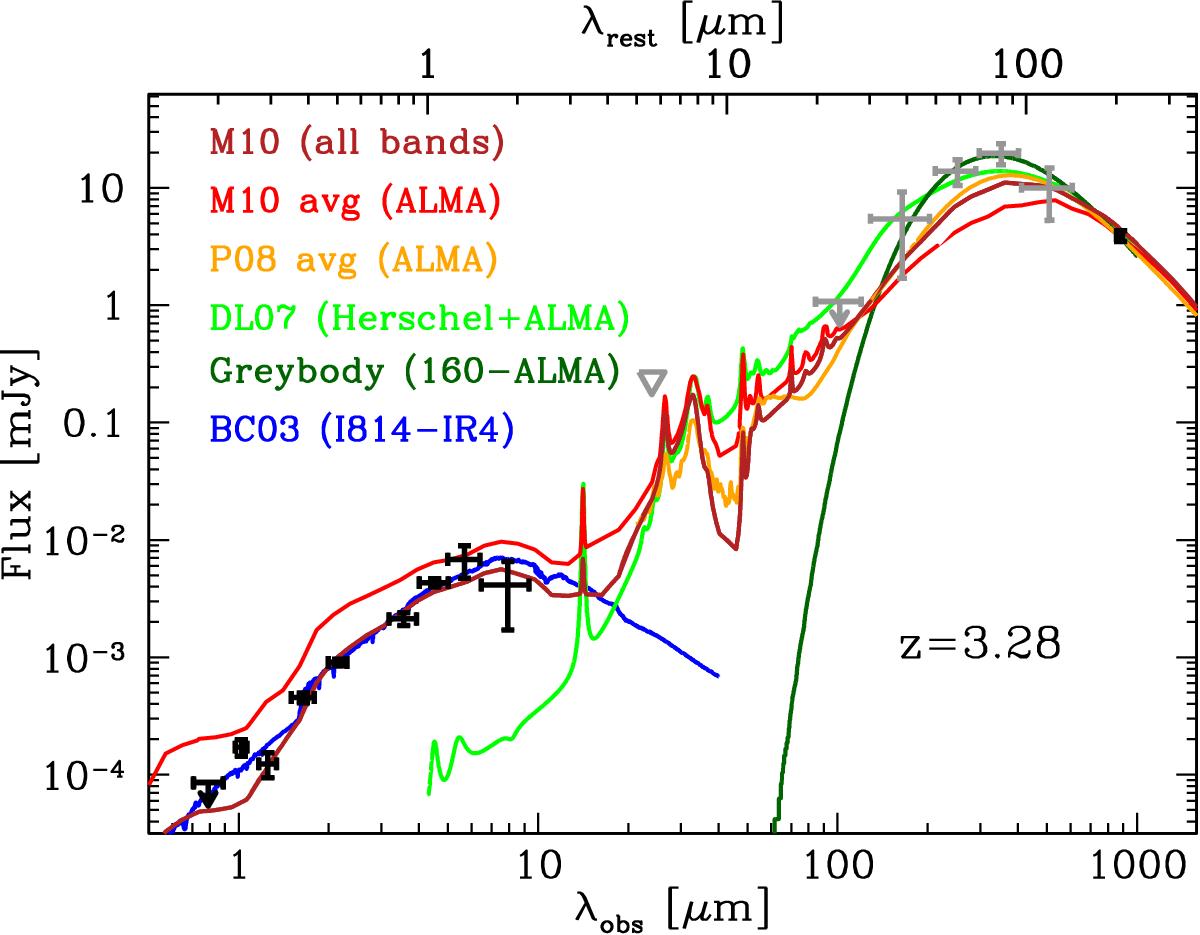
Best-fits of the ALMA-detected SMG. The black symbols show the measured fluxes, the grey symbols those estimated through assumptions in the Herschel bands (see text). The upside-down grey triangle shows the total 24 μm flux of the blended system. The blue curve shows the best fit of the optical-to-NIR photometry with the Bruzual & Charlot (2003, BC03) library; the brownish curve is the best fit of all available bands with the SMG templates of Michałowski et al. (2010b); the red and orange curves are the fit of the ALMA flux to the average SMG templates of Michałowski et al. (2010b) and Pope et al. (2008), respectively; the light green curve represents the best fit of the Draine & Li (2007) library to the Herschel and ALMA bands; finally, the dark green curve is the fit with a modified blackbody with emissivity index β = 2 to the 160 μm-to-ALMA bands. See text for further details.
Current usage metrics show cumulative count of Article Views (full-text article views including HTML views, PDF and ePub downloads, according to the available data) and Abstracts Views on Vision4Press platform.
Data correspond to usage on the plateform after 2015. The current usage metrics is available 48-96 hours after online publication and is updated daily on week days.
Initial download of the metrics may take a while.