Free Access
Fig. 8
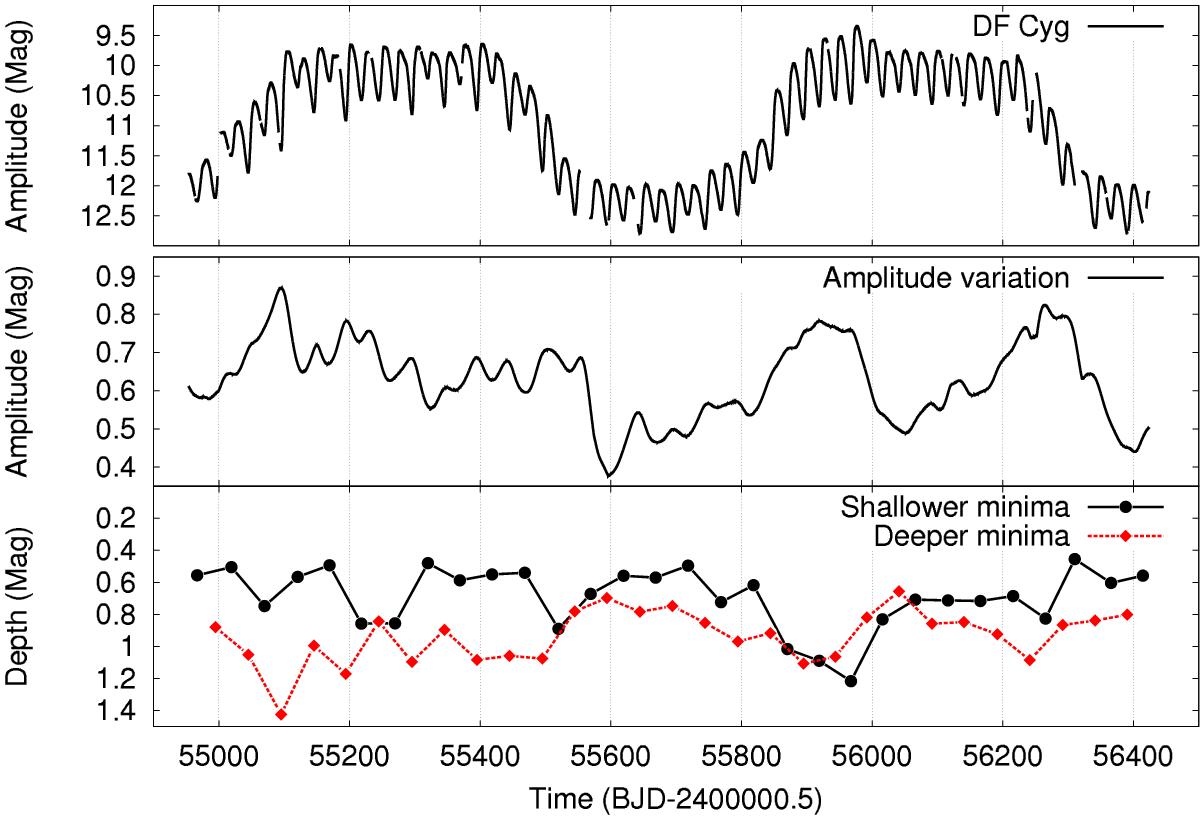
Top: original Kepler light curve for comparison. Middle: the amplitude variation of the sum of the 0.02, 0.04 and 0.08 c/d frequencies. Bottom: the variation of the depth of the shallower (black dots) and deeper minima (red diamonds).
Current usage metrics show cumulative count of Article Views (full-text article views including HTML views, PDF and ePub downloads, according to the available data) and Abstracts Views on Vision4Press platform.
Data correspond to usage on the plateform after 2015. The current usage metrics is available 48-96 hours after online publication and is updated daily on week days.
Initial download of the metrics may take a while.