Fig. 7
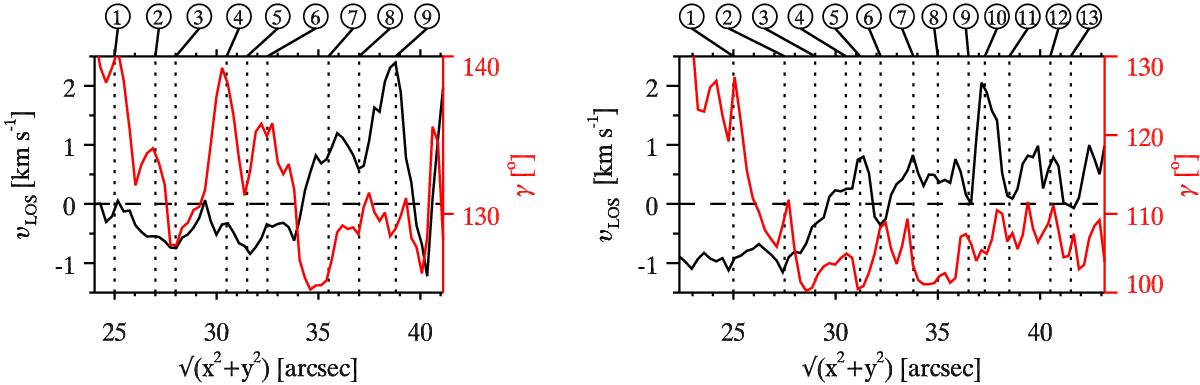
Variations of the LOS velocity, υLOS (black curve), and inclination of the magnetic field γ (red curve) obtained from the Hei triplet, along the middle (left panel) and outer (right panel) arcs shown in Fig. 1a. Numbered vertical lines in both panels represent the locations for which the variations of υLOS and γ are discussed in Sect. 5.
Current usage metrics show cumulative count of Article Views (full-text article views including HTML views, PDF and ePub downloads, according to the available data) and Abstracts Views on Vision4Press platform.
Data correspond to usage on the plateform after 2015. The current usage metrics is available 48-96 hours after online publication and is updated daily on week days.
Initial download of the metrics may take a while.