Fig. 6
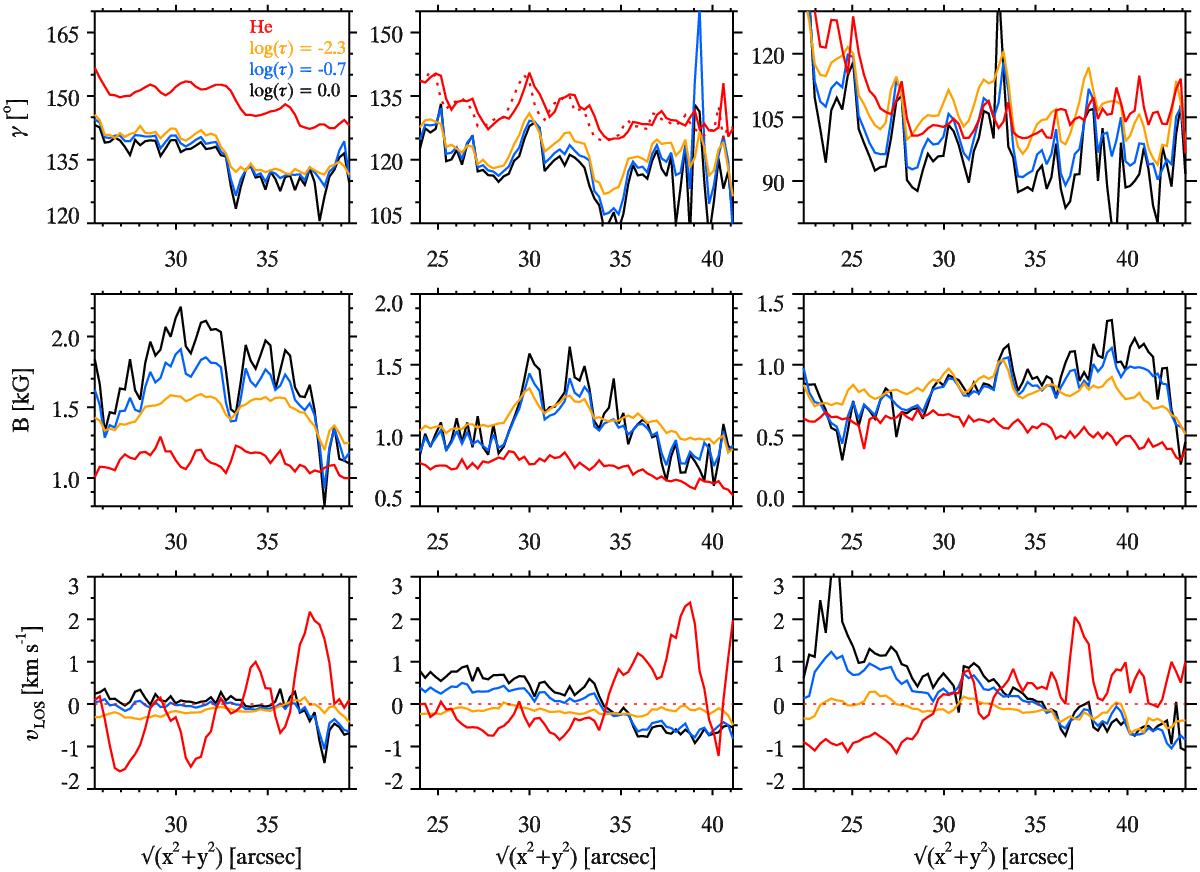
Profiles of the inclination of magnetic field, γ (top row), the magnetic field strength, B (middle row), and the LOS-velocity, υLOS (bottom row), along the arcs (see Fig. 1a) at the umbra-penumbra boundary (left column), middle penumbra (middle column), and outer penumbra (right column). Black, blue, yellow, and red curves correspond to log τ = 0.0,−0.7,−2.3, and the upper chromosphere, respectively. All the upper chromospheric parameters are plotted after correcting for the shift that is due to viewing angle and formation height. To illustrate this shift, an uncorrected profile is displayed by the dashed red line in the middle panel of the top row. The left of a panel corresponds to the bottom of the respective arc.
Current usage metrics show cumulative count of Article Views (full-text article views including HTML views, PDF and ePub downloads, according to the available data) and Abstracts Views on Vision4Press platform.
Data correspond to usage on the plateform after 2015. The current usage metrics is available 48-96 hours after online publication and is updated daily on week days.
Initial download of the metrics may take a while.