Fig. 4
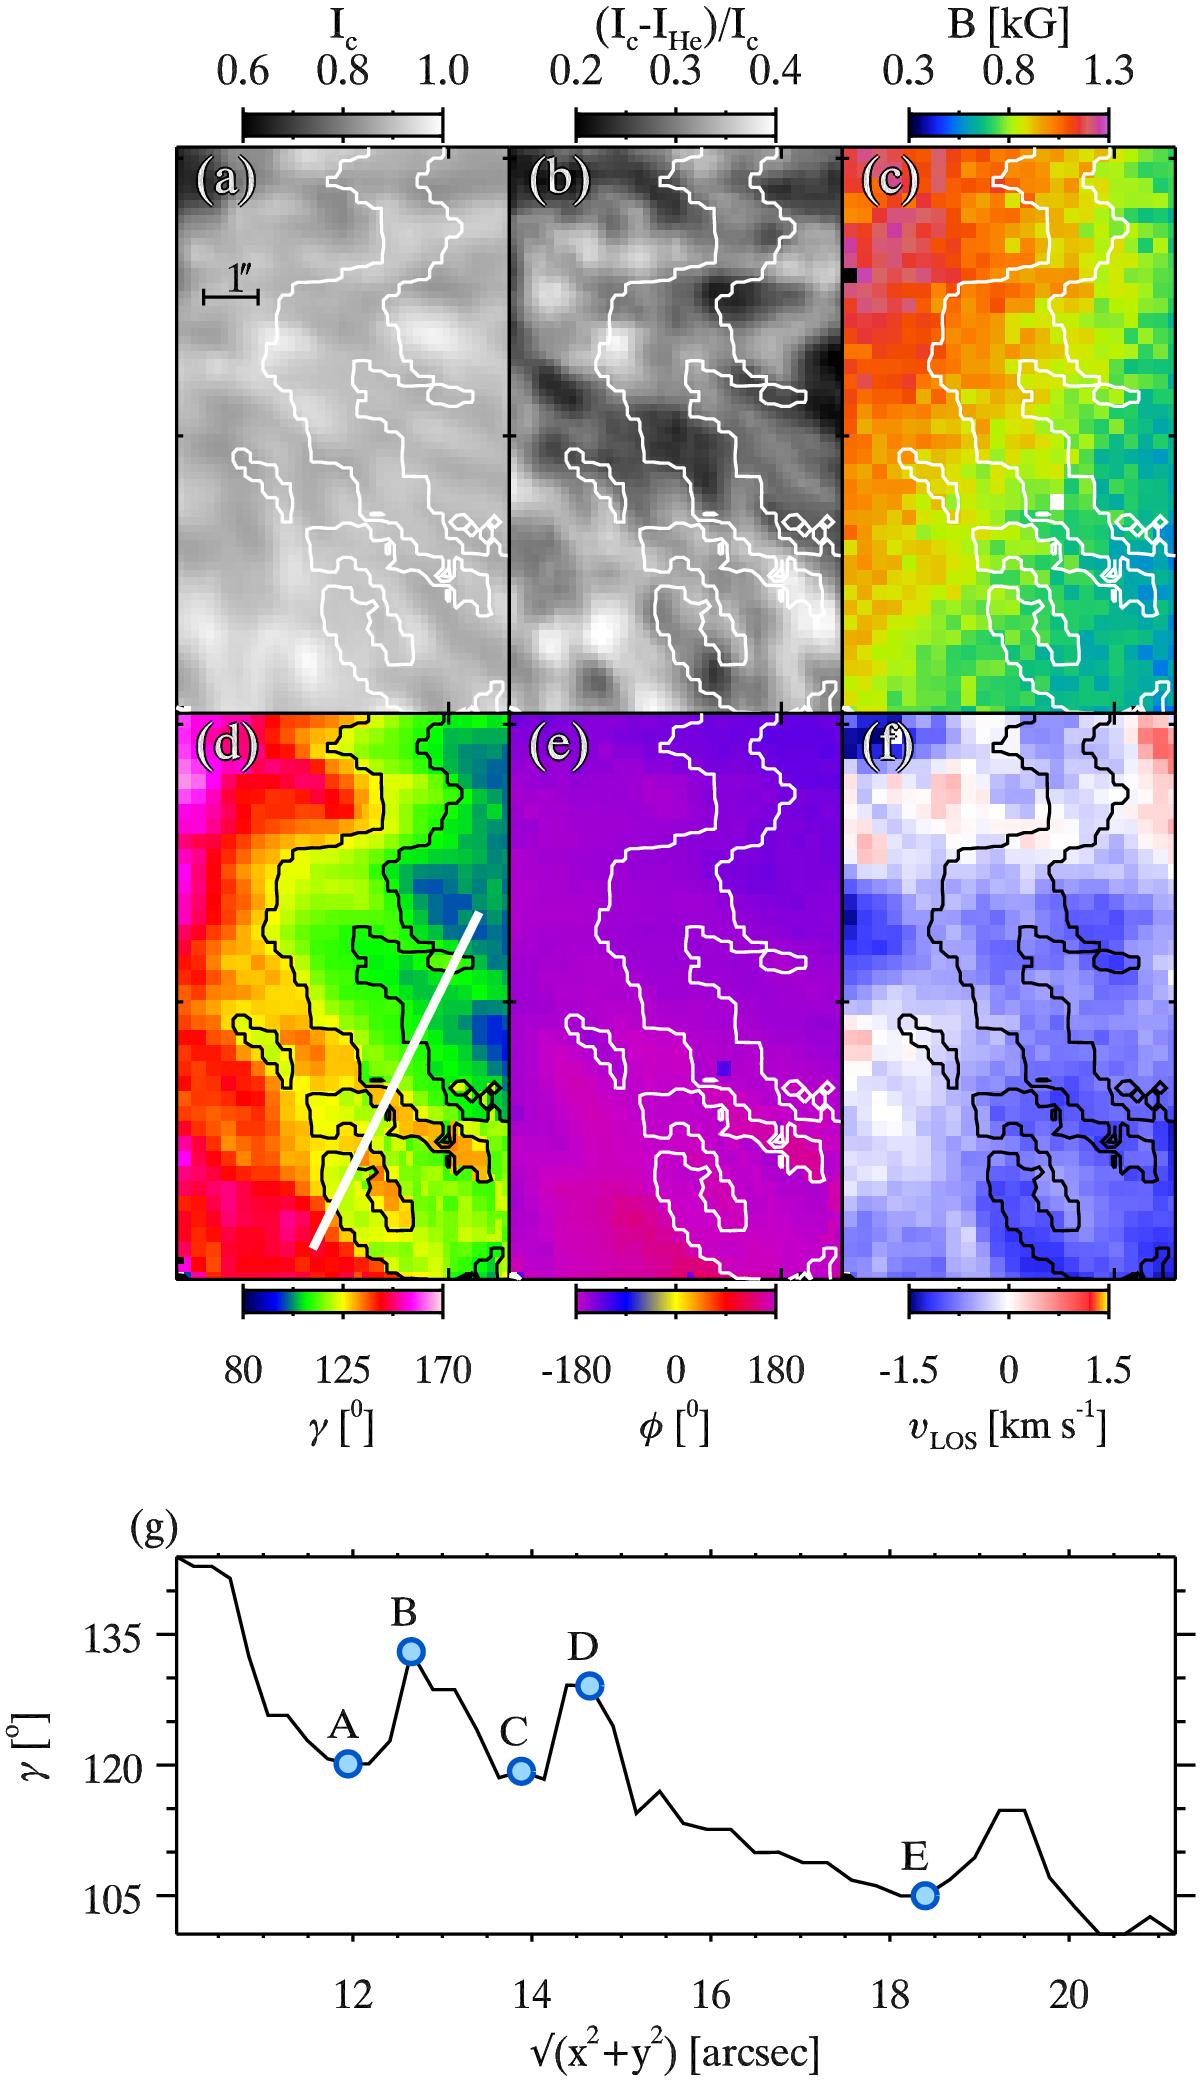
Details of penumbral fine structure in the upper chromosphere. a) Ic, b) (Ic−IHe) /Ic, c) B, d) γ, e) φ, and f) υLOS. The location of the maps is indicated by a box in the fourth map of Fig. 3b. Contours in panels a)– f) depict γ = 110°and125°. Panel g) depicts variations in γ along the white line marked in panel d). Blue circles identified as A–E in panel g) represent locations of observed and synthesized Stokes profiles of the Hei triplet plotted in Fig. 5.
Current usage metrics show cumulative count of Article Views (full-text article views including HTML views, PDF and ePub downloads, according to the available data) and Abstracts Views on Vision4Press platform.
Data correspond to usage on the plateform after 2015. The current usage metrics is available 48-96 hours after online publication and is updated daily on week days.
Initial download of the metrics may take a while.