Fig. 3
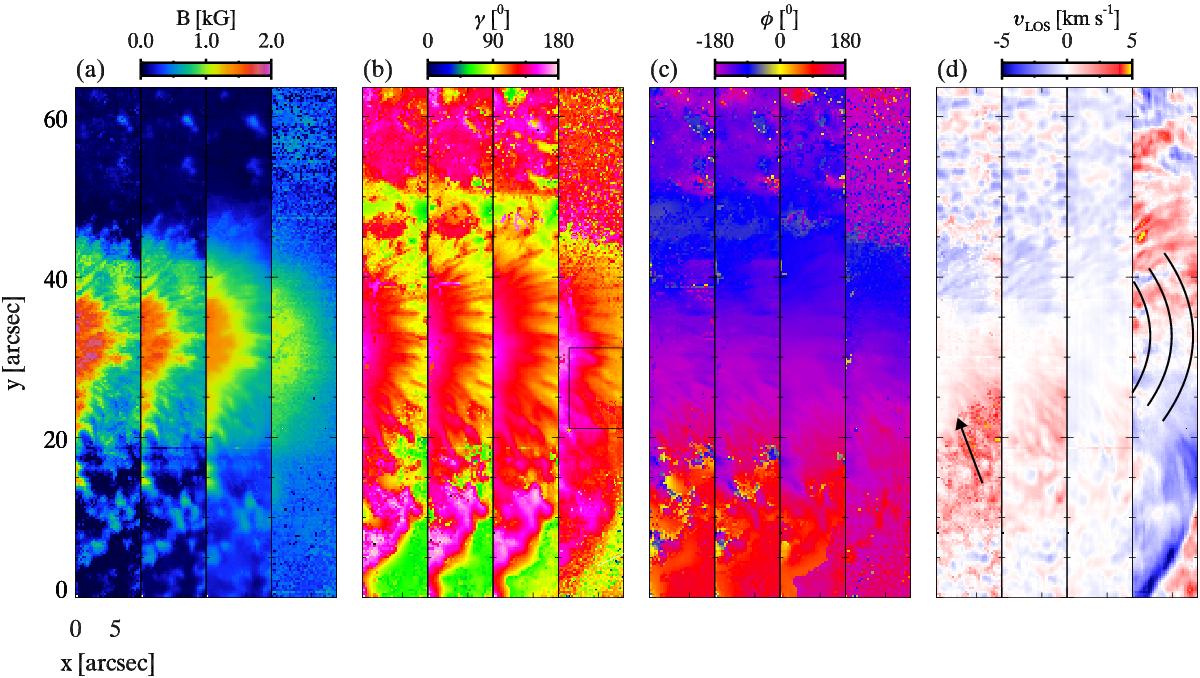
Maps of the magnetic field vector (from left to right: magnetic field strength, B, inclination, γ, azimuth, φ) and LOS-velocity, υLOS, in the photosphere and upper chromosphere. The first three maps in every panel correspond to log τ = 0.0, log τ = −0.7 and log τ = −2.3 (SPINOR inversion of the Sii and Cai lines), and the fourth map refers to the upper chromosphere (HeLIx+ inversion of the Hei triplet). The box in the fourth map of panel b) represents the location for which details of various parameters are displayed in Fig. 4. Three arcs in panel d) show the locations of various parameters that are depicted in Figs. 6 and 7. An arrow in panel d) indicates the disk center direction.
Current usage metrics show cumulative count of Article Views (full-text article views including HTML views, PDF and ePub downloads, according to the available data) and Abstracts Views on Vision4Press platform.
Data correspond to usage on the plateform after 2015. The current usage metrics is available 48-96 hours after online publication and is updated daily on week days.
Initial download of the metrics may take a while.