Fig. 2
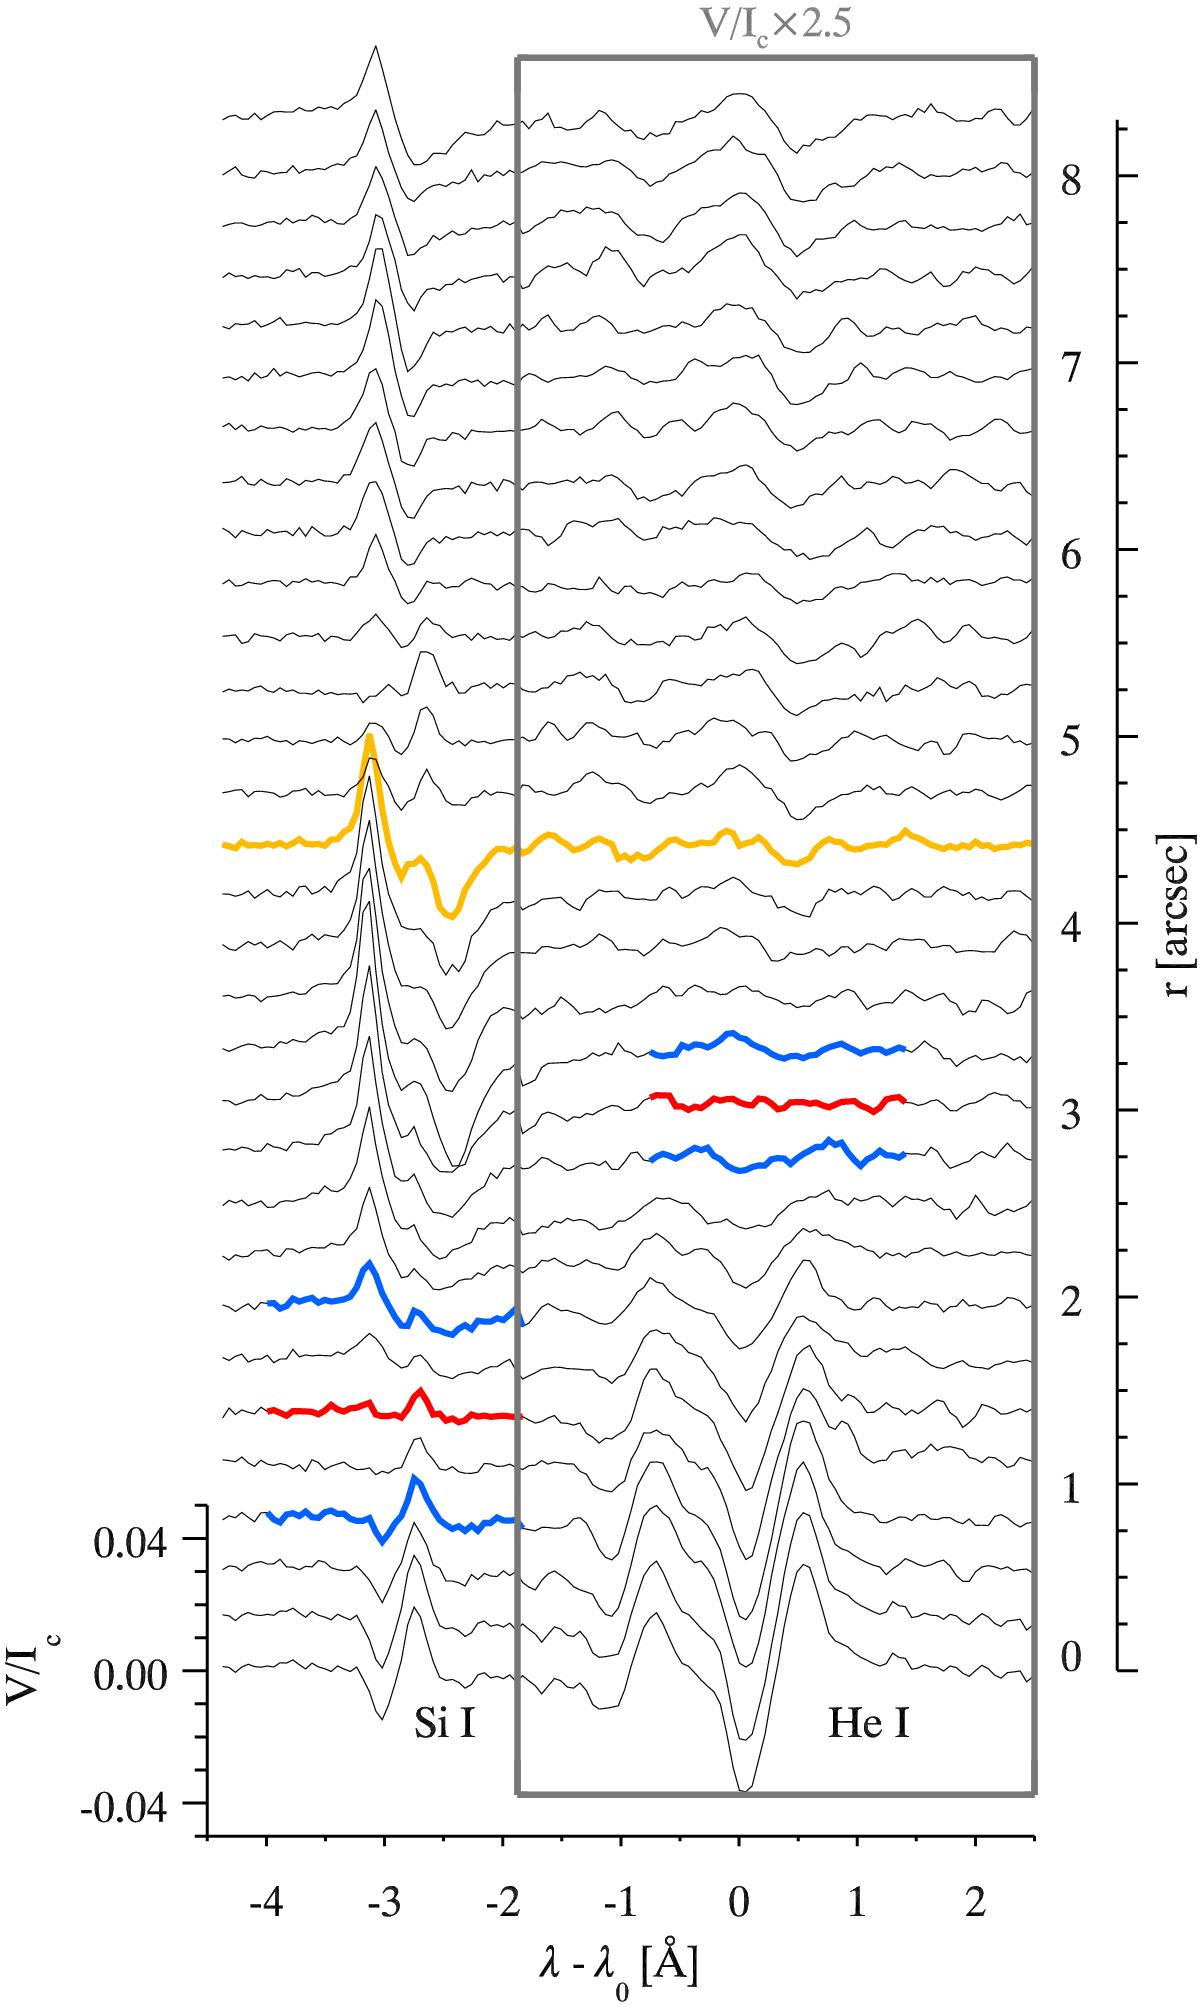
Stokes V profiles over a spectral range covering the Sii 10 827.1 Å line and Hei triplet at 10 830 Å. Positions of the plotted profiles are indicated by a red line in Fig. 1d, the lowermost profile belongs to the pixel closest within the sunspot to the sunspot center. Since the Stokes V signal in the Hei triplet is weaker than the Sii line, it is magnified by a factor of 2.5 (see box). The right side of the axis in the plot gives the distance, r, in seconds of arc from the lowermost profile. Profiles plotted in red indicate the position of the polarity inversion line and those colored in blue indicate the nearest profiles with clearly visible opposite polarity. A yellow profile at ![]() marks the transition from the penumbral region to the quiet Sun.
marks the transition from the penumbral region to the quiet Sun.
Current usage metrics show cumulative count of Article Views (full-text article views including HTML views, PDF and ePub downloads, according to the available data) and Abstracts Views on Vision4Press platform.
Data correspond to usage on the plateform after 2015. The current usage metrics is available 48-96 hours after online publication and is updated daily on week days.
Initial download of the metrics may take a while.