Fig. 1
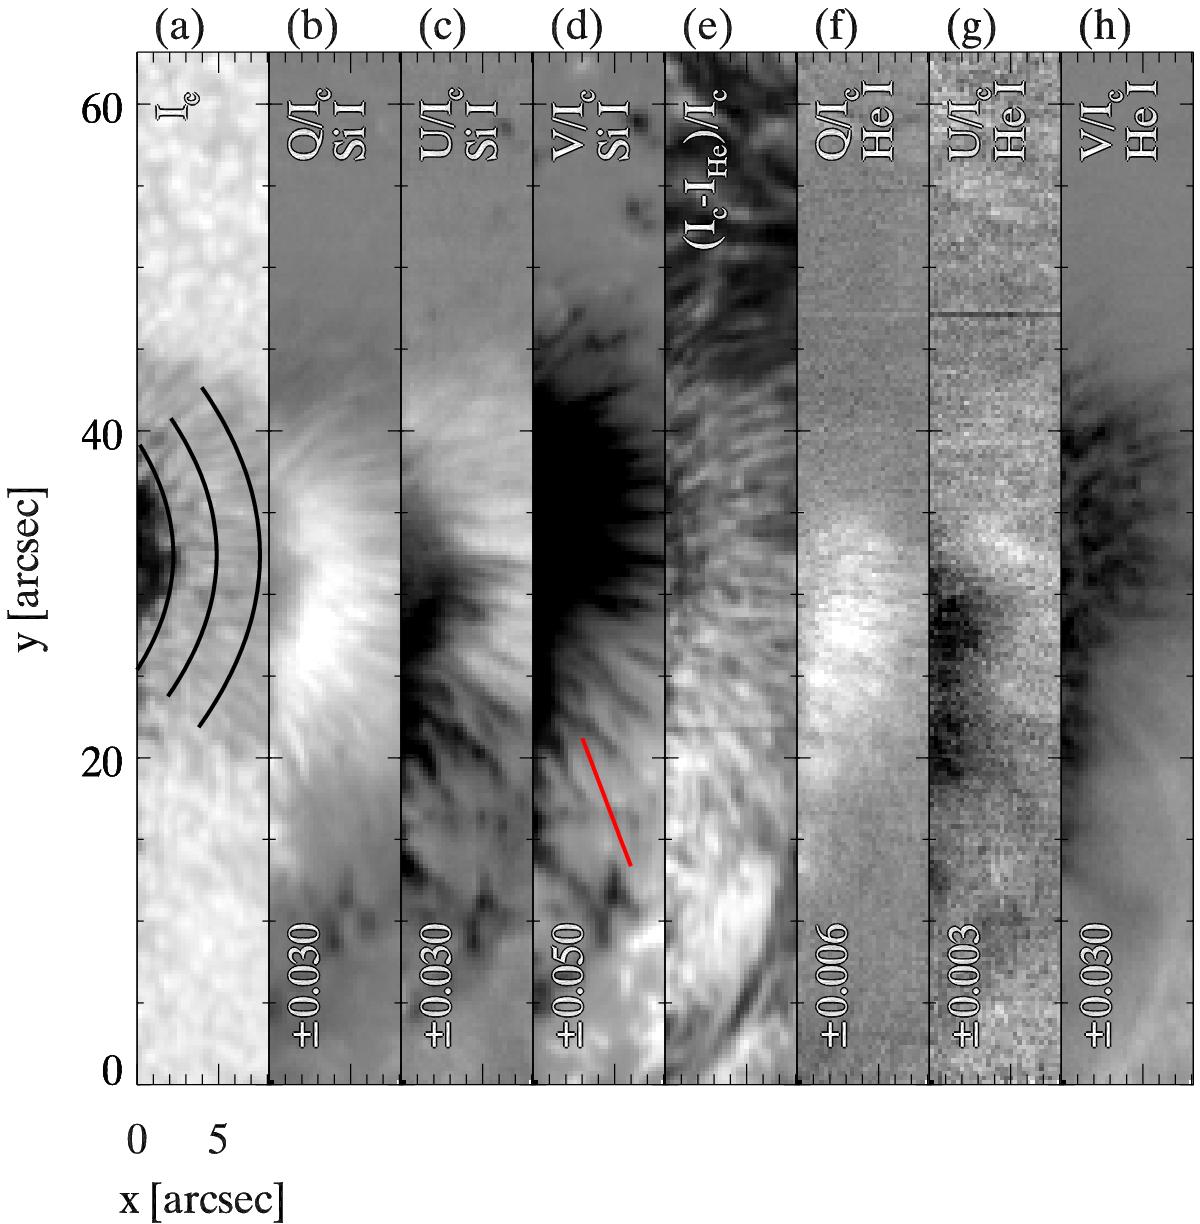
Maps of Stokes parameters for the Sii 10 827.1 Å line and the Hei triplet at 10 830 Å. Panel a) shows the continuum intensity, Ic, at 10 833 Å. Panels b)−d) corresponds to Stokes Q/Ic, U/Ic, and V/Ic maps of the Sii line, respectively. The line depression of the blended red components of the Hei triplet, (Ic−IHe) /Ic, is displayed in panel e). Stokes Q/Ic, U/Ic, and V/Ic maps for the Hei triplet are presented in panels e)−g), respectively. The lower and upper limits of the Stokes Q/Ic, U/Ic, and V/Ic maps are indicated in the lower part of the respective image. The Stokes maps presented here are an average over a range 0.27 Å wide centered on λ−λ0 = −3.10 Å and λ−λ0 = −0.35 Å for the Sii line and Hei triplet, respectively, with λ0 = 10 830 Å. The Stokes V/Ic profiles along the red line marked in panel d) are plotted in Fig. 2. The lower part of the line is directed toward the closest part of the solar limb. Three arcs in panel a) show the locations of various parameters that are depicted in Fig. 6.
Current usage metrics show cumulative count of Article Views (full-text article views including HTML views, PDF and ePub downloads, according to the available data) and Abstracts Views on Vision4Press platform.
Data correspond to usage on the plateform after 2015. The current usage metrics is available 48-96 hours after online publication and is updated daily on week days.
Initial download of the metrics may take a while.