Fig. 3
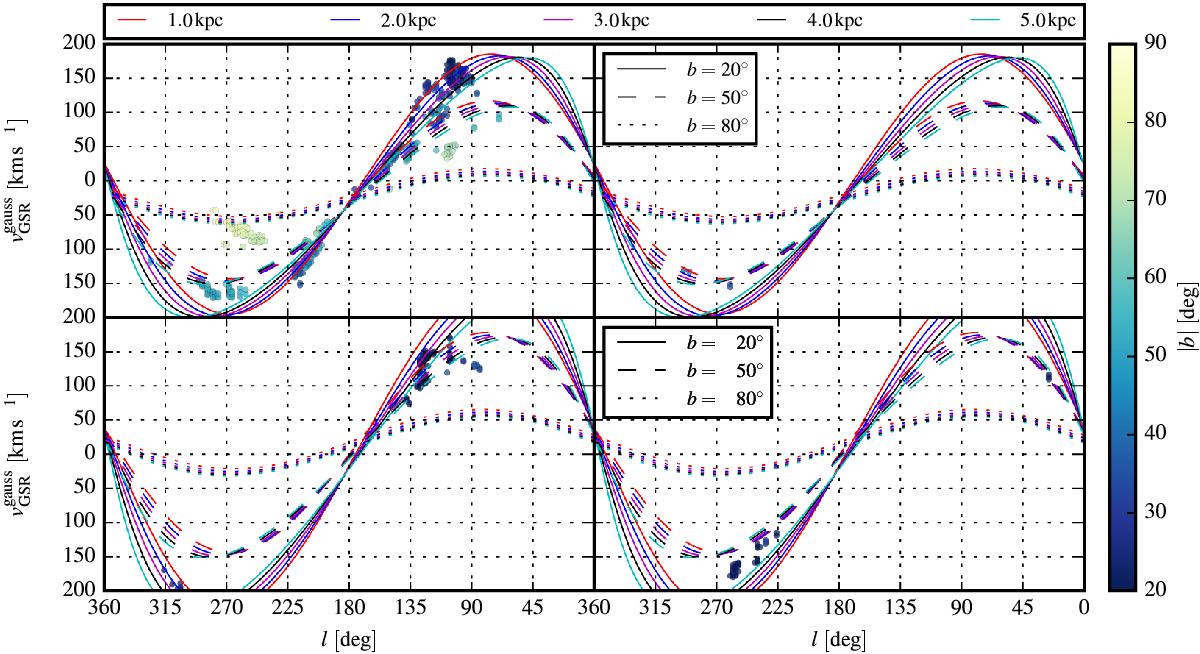
Radial GSR velocities of northern (top) and southern (bottom) MIVC± samples compared with Galactic longitudes l, left for the MIVCs−, right for the MIVCs+. The velocities of the individual candidates are given by the ![]() from the Gaussian decomposition of the H i survey data. The colour of each point encodes the absolute value of the latitude coordinate b of the candidates as indicated by the colour bar. The different lines show the modelled rotation velocities including a radial, vertical, and lagging velocity component as estimated by Marasco & Fraternali (2011). Their vertical height z = 1.6 kpc is assumed, for which the velocities are modelled at some heliocentric distances d and latitudes b as given in the legends. The solid, dashed, and dotted lines are for b = 20°, b = 50°, and b = 80°. The red, blue, magenta, black, and cyan lines are for heliocentric distances within the Galactic plane of d = 1 kpc, 2 kpc, 3 kpc, 4 kpc, and 5 kpc.
from the Gaussian decomposition of the H i survey data. The colour of each point encodes the absolute value of the latitude coordinate b of the candidates as indicated by the colour bar. The different lines show the modelled rotation velocities including a radial, vertical, and lagging velocity component as estimated by Marasco & Fraternali (2011). Their vertical height z = 1.6 kpc is assumed, for which the velocities are modelled at some heliocentric distances d and latitudes b as given in the legends. The solid, dashed, and dotted lines are for b = 20°, b = 50°, and b = 80°. The red, blue, magenta, black, and cyan lines are for heliocentric distances within the Galactic plane of d = 1 kpc, 2 kpc, 3 kpc, 4 kpc, and 5 kpc.
Current usage metrics show cumulative count of Article Views (full-text article views including HTML views, PDF and ePub downloads, according to the available data) and Abstracts Views on Vision4Press platform.
Data correspond to usage on the plateform after 2015. The current usage metrics is available 48-96 hours after online publication and is updated daily on week days.
Initial download of the metrics may take a while.