Fig. 2
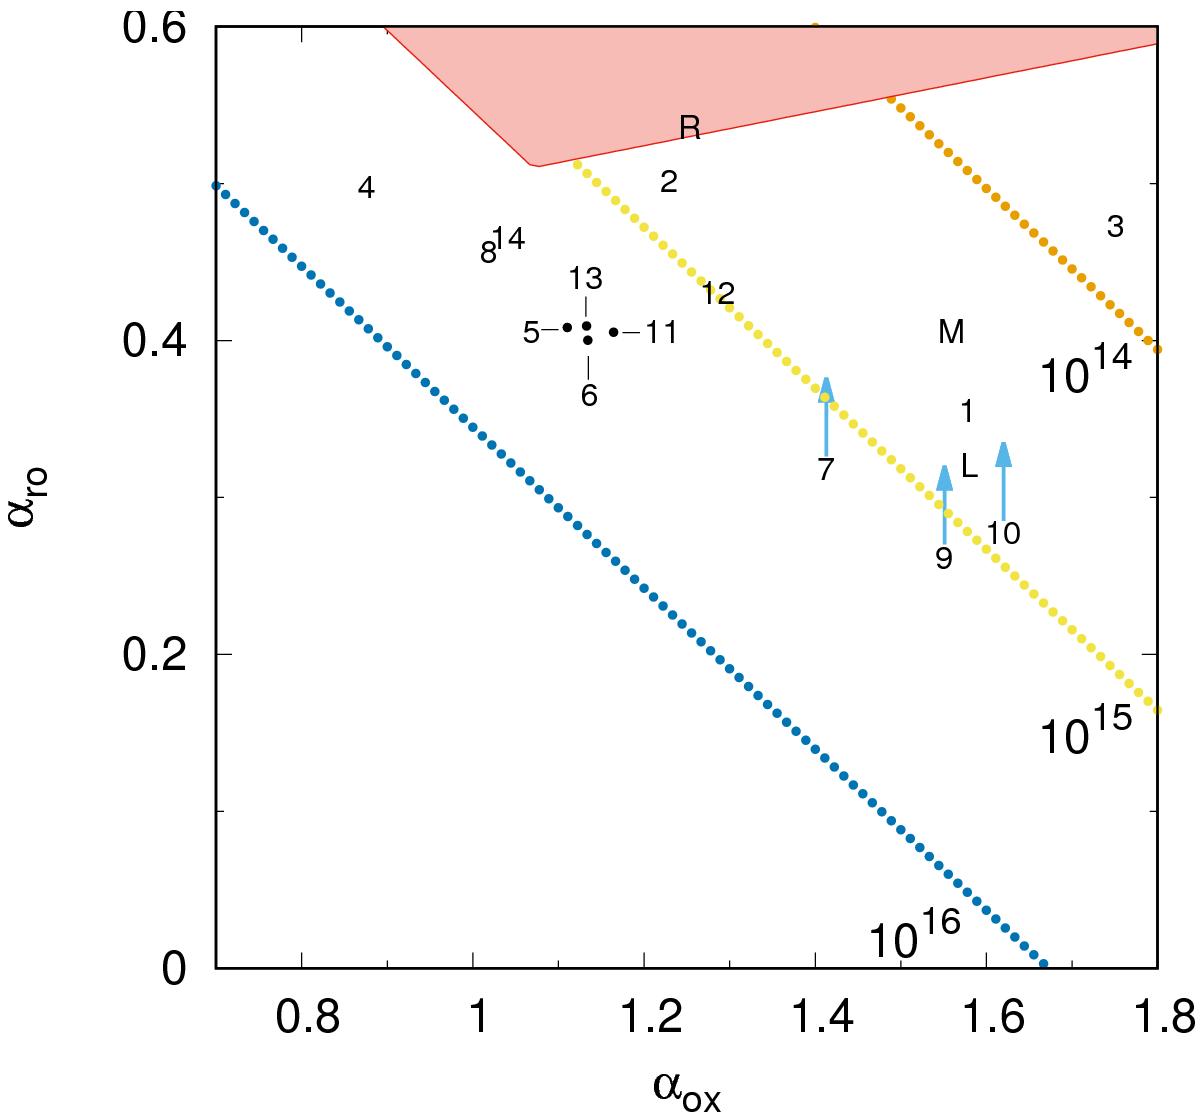
Analysed sources in the spectral indices αox−αro plane. Lower limits are indicated with an arrow. Numbers refer to the values presented in Table 1, while letters L, M, and R refer to the objects in Landi et al. (2015b,a) associated by Landoni et al. (2015), Massaro et al. (2015b), and Ricci et al. (2015), respectively. Sources 5, 6, 11 and 13 are shown as points for the sake of clarity. The red shaded area indicates the region where the relationship describing synchrotron peak values changes its functional form, as explained in Abdo et al. (2010).
Current usage metrics show cumulative count of Article Views (full-text article views including HTML views, PDF and ePub downloads, according to the available data) and Abstracts Views on Vision4Press platform.
Data correspond to usage on the plateform after 2015. The current usage metrics is available 48-96 hours after online publication and is updated daily on week days.
Initial download of the metrics may take a while.