Fig. 9
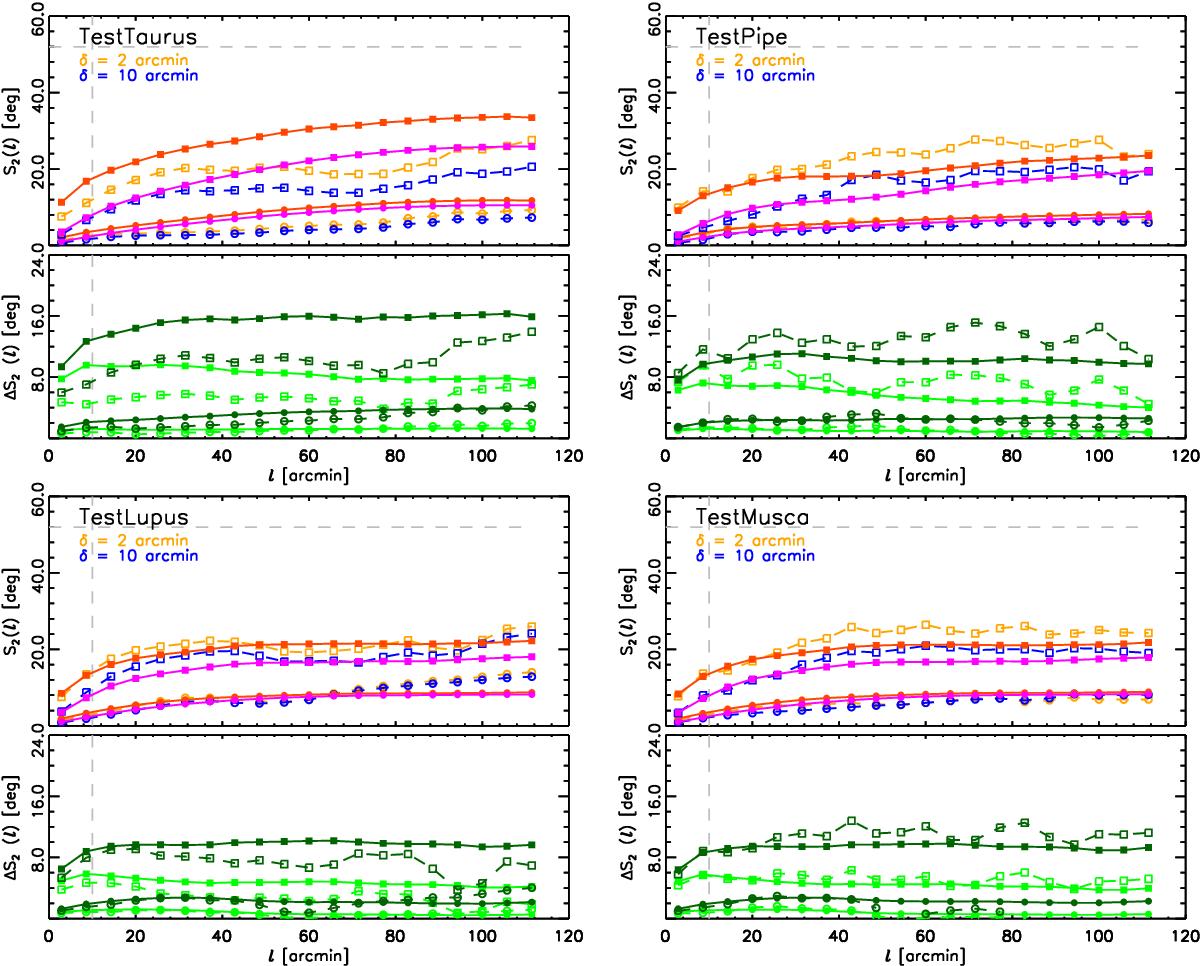
Structure functions S2(ℓ) calculated from the Gaussian polarization models corresponding to fM = 1.0 and αM = −2.5 (circles) and αM = −1.5 (squares), with angular resolutions δ = 2′ (orange and red), 10′ (blue and magenta). The dashed lines with open symbols, shown in orange and blue, correspond to S2(ℓ) calculated using only the values of QM and UM towards lines of sights with starlight polarization observations towards each region. The solid lines with filled symbols, shown in red and magenta, correspond to S2(ℓ) calculated using 10 000 LOSs randomly distributed overin each region. In the lower plot of each panel, we present the differences, ![]() (dark green), and
(dark green), and ![]() (light green). There is no noise included in the Gaussian models of polarization, so no bias correction is necessary.
(light green). There is no noise included in the Gaussian models of polarization, so no bias correction is necessary.
Current usage metrics show cumulative count of Article Views (full-text article views including HTML views, PDF and ePub downloads, according to the available data) and Abstracts Views on Vision4Press platform.
Data correspond to usage on the plateform after 2015. The current usage metrics is available 48-96 hours after online publication and is updated daily on week days.
Initial download of the metrics may take a while.