Fig. 7
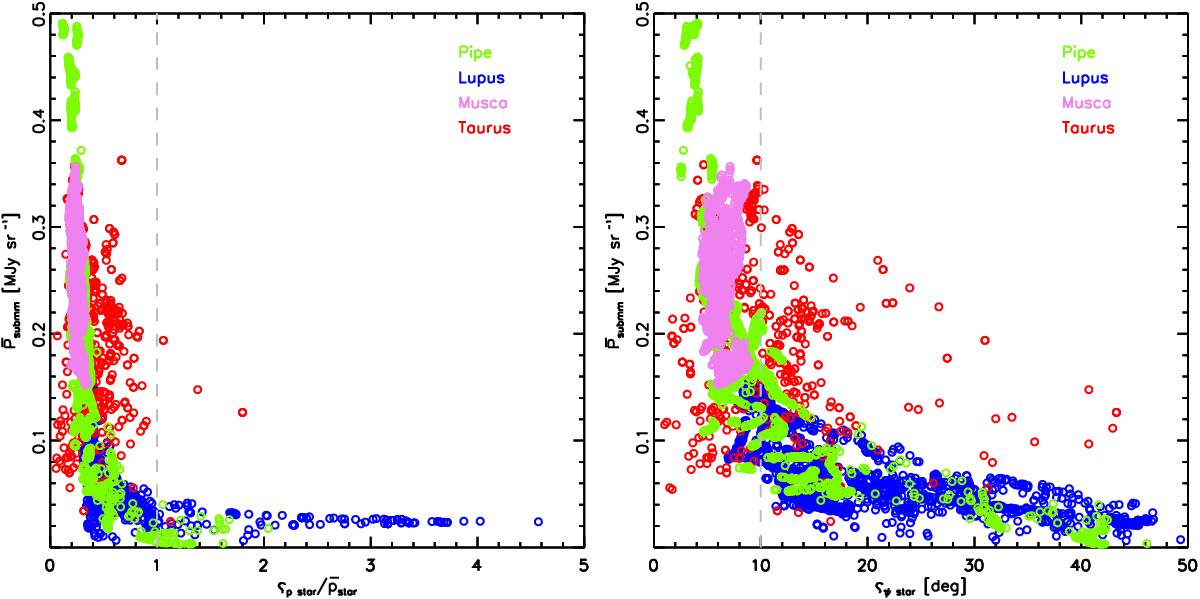
Scatter plot of the fluctuations in polarized fraction, ![]() (left), and the dispersion of orientation angles, ςψstar (right), against the mean values of the total polarized flux from the Planck 353 GHz observations in all the 10′ vicinities with more than three stars towards each observed region. The dashed gray lines, included just for reference, correspond to
(left), and the dispersion of orientation angles, ςψstar (right), against the mean values of the total polarized flux from the Planck 353 GHz observations in all the 10′ vicinities with more than three stars towards each observed region. The dashed gray lines, included just for reference, correspond to ![]() (left) and ςψstar = 10° (right).
(left) and ςψstar = 10° (right).
Current usage metrics show cumulative count of Article Views (full-text article views including HTML views, PDF and ePub downloads, according to the available data) and Abstracts Views on Vision4Press platform.
Data correspond to usage on the plateform after 2015. The current usage metrics is available 48-96 hours after online publication and is updated daily on week days.
Initial download of the metrics may take a while.