Fig. 6
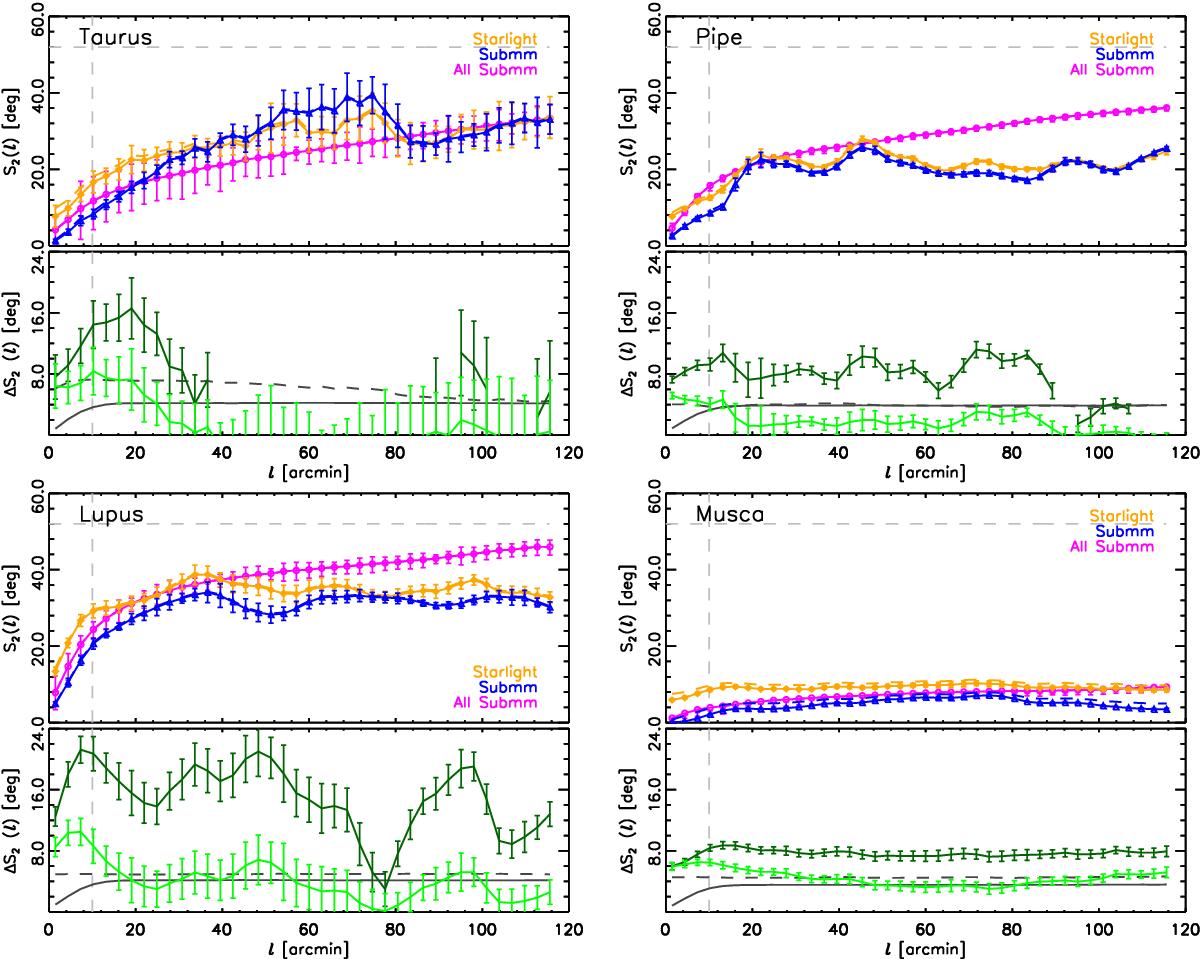
Structure functions of the starlight polarization ![]() (orange), submillimetre polarization along the lines of sight to stars,
(orange), submillimetre polarization along the lines of sight to stars, ![]() (blue), and submillimetre polarization over the whole map,
(blue), and submillimetre polarization over the whole map, ![]() (magenta).In the lower plot of each panel we present the differences
(magenta).In the lower plot of each panel we present the differences ![]() (dark green),
(dark green), ![]() (light green), and the corresponding bias corrections,
(light green), and the corresponding bias corrections, ![]() (dashed gray) and
(dashed gray) and ![]() (solid gray). The vertical dashed line indicates the effective size of the Planck beam. The horizontal dashed line in the upper plot of each panel indicates
(solid gray). The vertical dashed line indicates the effective size of the Planck beam. The horizontal dashed line in the upper plot of each panel indicates ![]() rad ≈52°, which corresponds to a random distribution of orientations.
rad ≈52°, which corresponds to a random distribution of orientations.
Current usage metrics show cumulative count of Article Views (full-text article views including HTML views, PDF and ePub downloads, according to the available data) and Abstracts Views on Vision4Press platform.
Data correspond to usage on the plateform after 2015. The current usage metrics is available 48-96 hours after online publication and is updated daily on week days.
Initial download of the metrics may take a while.