Fig. 3
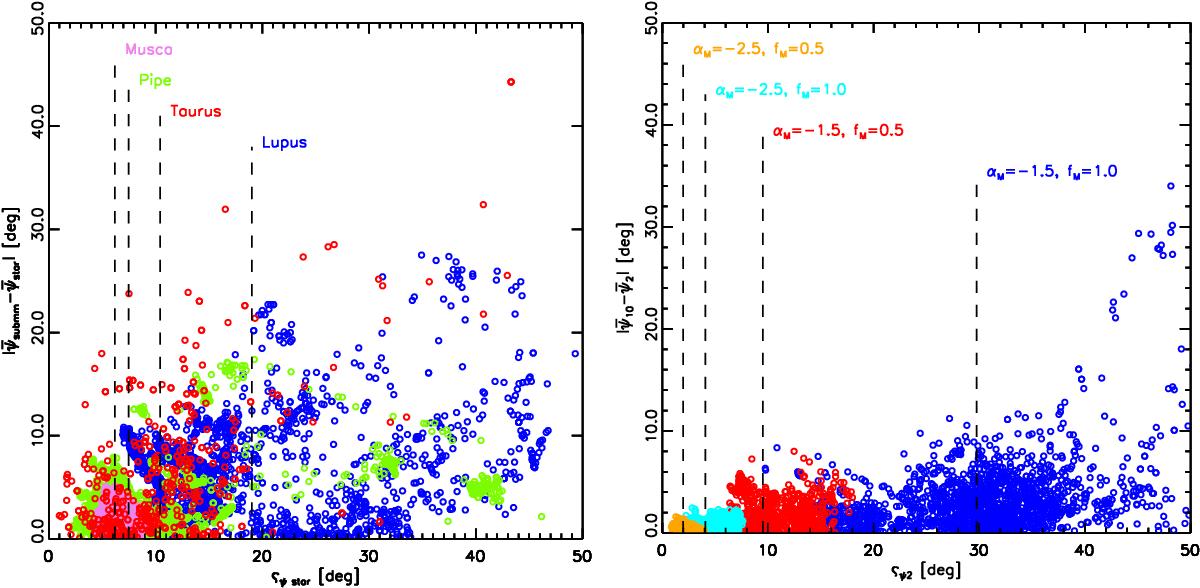
Scatter plot of the differences between the mean field orientations inferred from starlight and submillimetre polarization, ![]() , against the dispersion of orientation angles, ςψstar, in all the 10′ vicinities with more than three stars towards each observed region (left) and towards the Gaussian polarization models introduced in Sect. 3(right). The dashed vertical lines indicate the mean values of ςψstar.
, against the dispersion of orientation angles, ςψstar, in all the 10′ vicinities with more than three stars towards each observed region (left) and towards the Gaussian polarization models introduced in Sect. 3(right). The dashed vertical lines indicate the mean values of ςψstar.
Current usage metrics show cumulative count of Article Views (full-text article views including HTML views, PDF and ePub downloads, according to the available data) and Abstracts Views on Vision4Press platform.
Data correspond to usage on the plateform after 2015. The current usage metrics is available 48-96 hours after online publication and is updated daily on week days.
Initial download of the metrics may take a while.