Free Access
Fig. 2
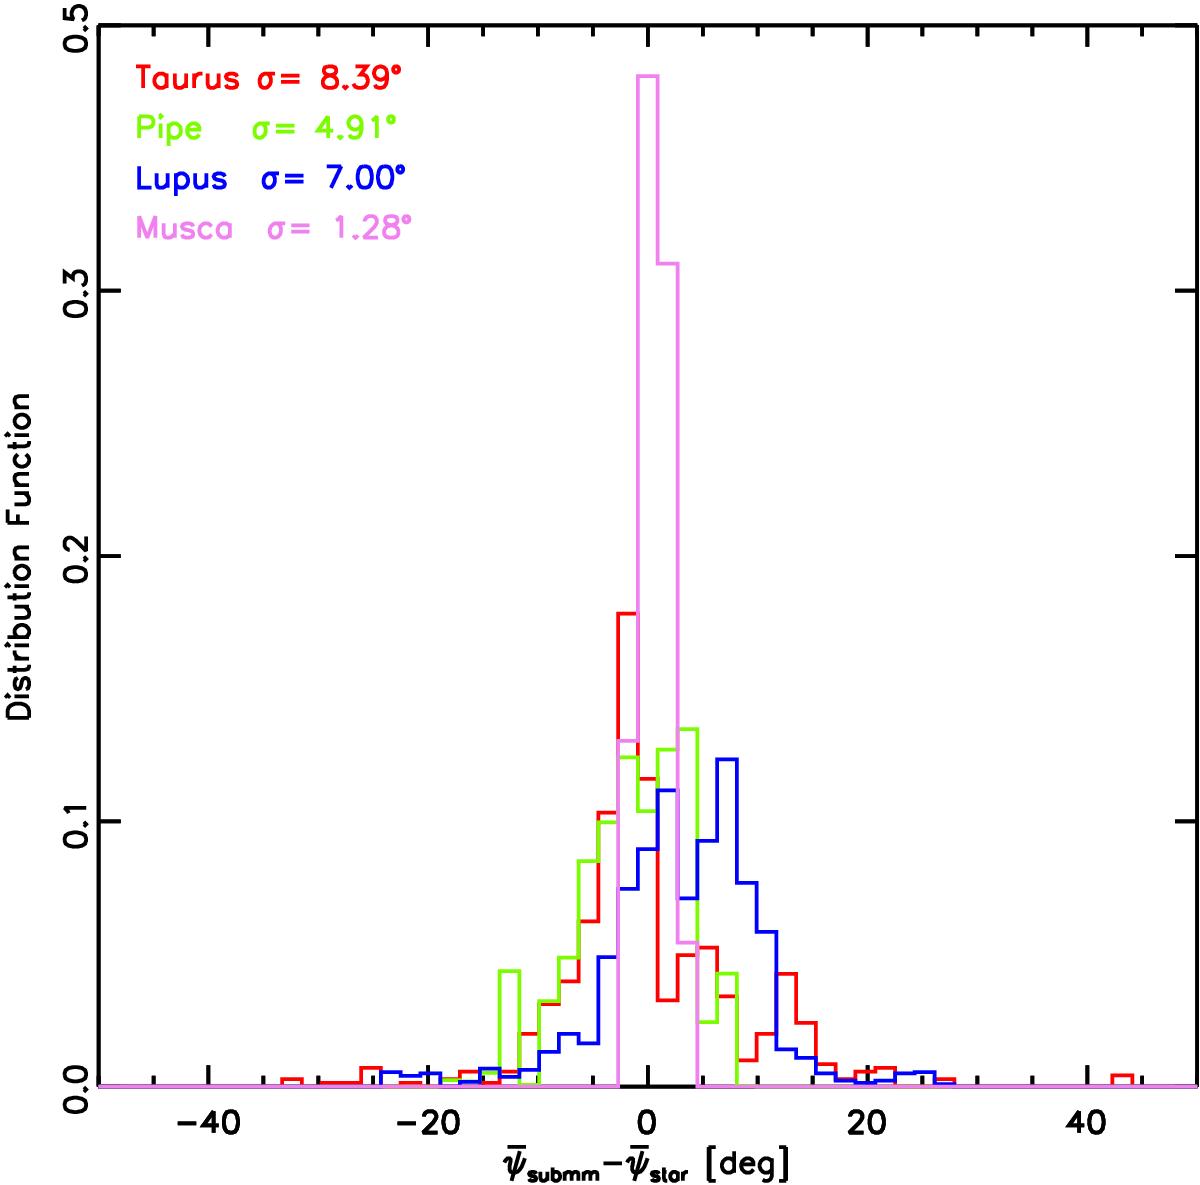
Distributions of the differences ![]() between the mean orientation of
between the mean orientation of ![]() and
and ![]() within each 10′ vicinity, for each field. The dispersions σ of the histograms are given in the top left corner.
within each 10′ vicinity, for each field. The dispersions σ of the histograms are given in the top left corner.
Current usage metrics show cumulative count of Article Views (full-text article views including HTML views, PDF and ePub downloads, according to the available data) and Abstracts Views on Vision4Press platform.
Data correspond to usage on the plateform after 2015. The current usage metrics is available 48-96 hours after online publication and is updated daily on week days.
Initial download of the metrics may take a while.