Fig. A.1
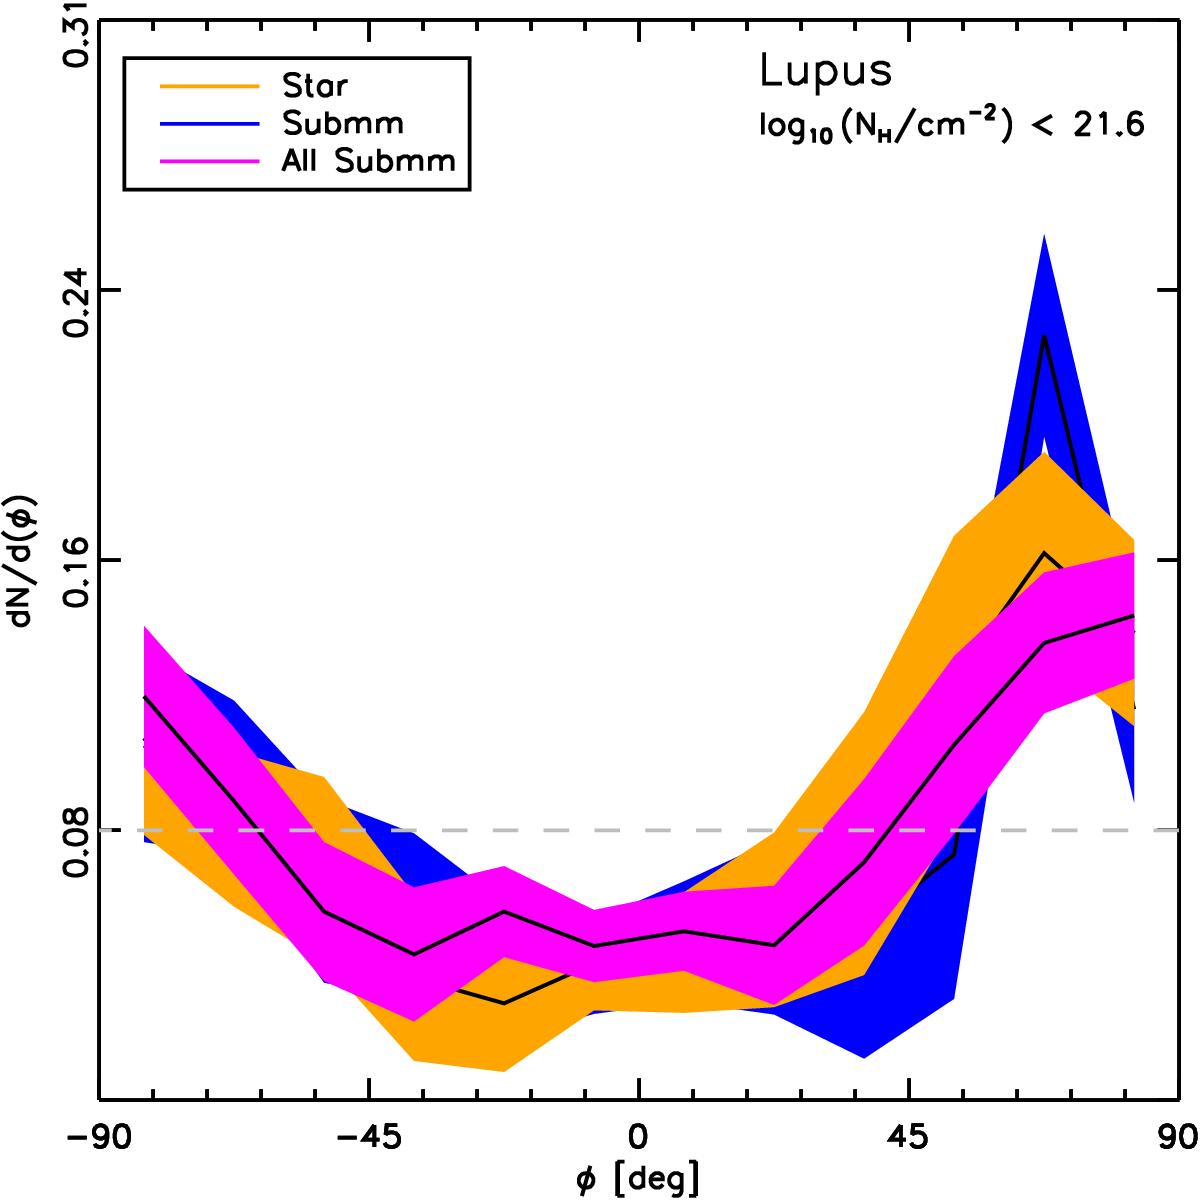
Histograms of relative orientations between ![]() and the iso-τ353 contours towards Lupus. Histograms peaking at 90° and/or −90° correspond to
and the iso-τ353 contours towards Lupus. Histograms peaking at 90° and/or −90° correspond to ![]() predominantly perpendicular to iso-τ353 contours. In contrast with Planck Collaboration Int. XXXV (2016), the error bars are estimated by sampling of a Gaussian polarization model, including – by construction – spatial correlations which are absent when considering simple Poissonian statistics.
predominantly perpendicular to iso-τ353 contours. In contrast with Planck Collaboration Int. XXXV (2016), the error bars are estimated by sampling of a Gaussian polarization model, including – by construction – spatial correlations which are absent when considering simple Poissonian statistics.
Current usage metrics show cumulative count of Article Views (full-text article views including HTML views, PDF and ePub downloads, according to the available data) and Abstracts Views on Vision4Press platform.
Data correspond to usage on the plateform after 2015. The current usage metrics is available 48-96 hours after online publication and is updated daily on week days.
Initial download of the metrics may take a while.