Fig. 1
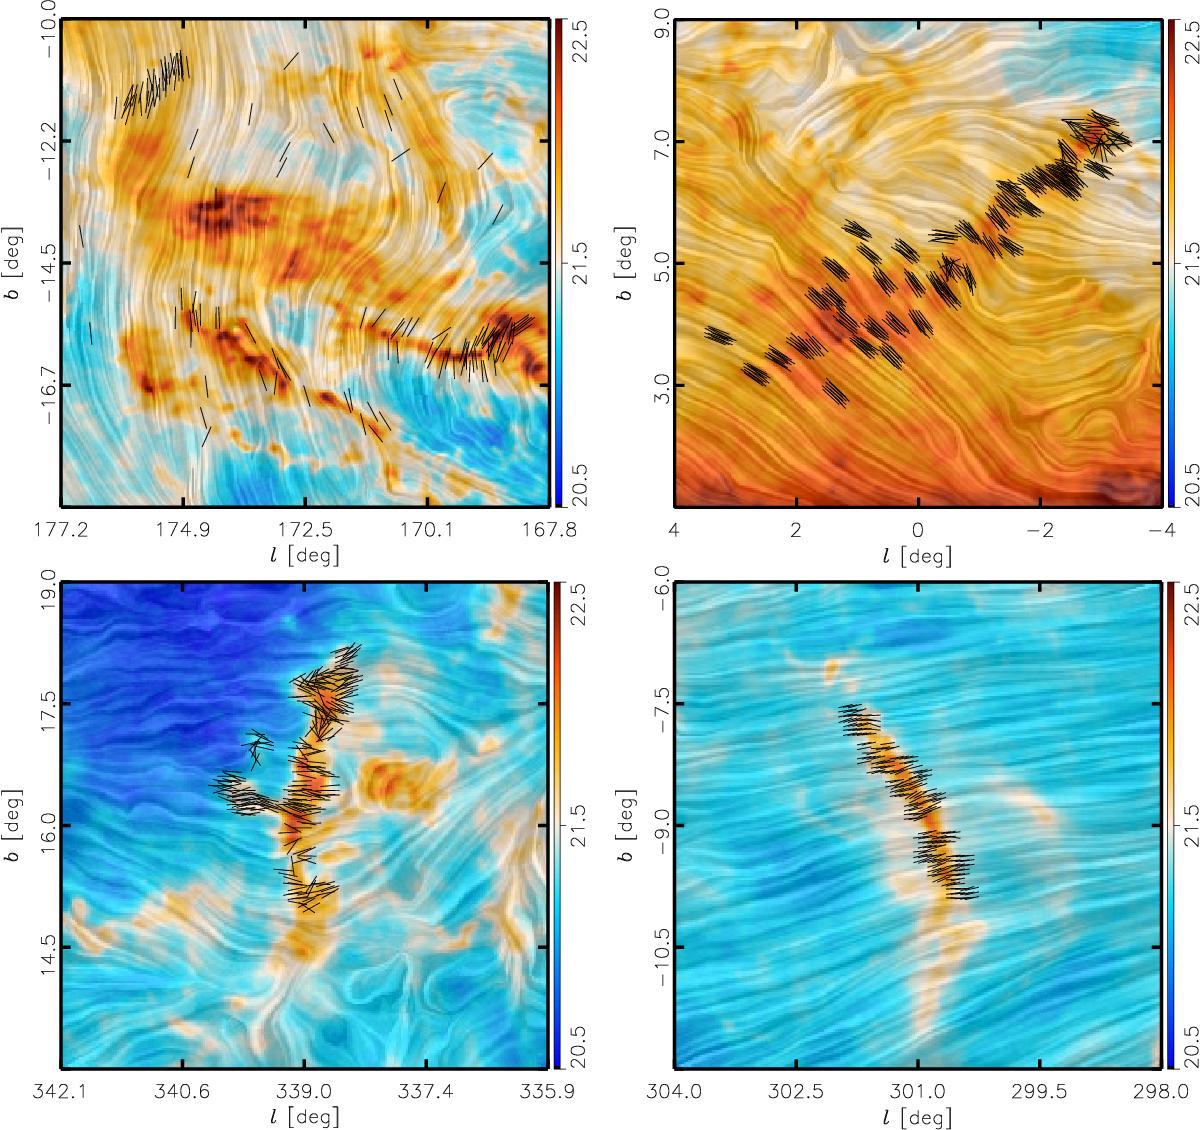
Magnetic field orientations inferred from submillimetre emission and visible or NIR extinction polarization observations towards the Taurus (top left), Pipe (top right), Lupus I (bottom left), and Musca (bottom right) molecular clouds. The colors represent the total gas column density in logarithmic scale. The drapery pattern, produced using the line integral convolution (LIC, Cabral & Leedom 1993), indicates the magnetic field orientation, orthogonal to the orientation of the submillimetre polarization. The black pseudo-vectors indicate the magnetic field orientation from starlight polarization in the corresponding lines-of-sight. Each pseudo-vector represents the average field orientation inferred from the stars within 3.́5-diameter vicinities.
Current usage metrics show cumulative count of Article Views (full-text article views including HTML views, PDF and ePub downloads, according to the available data) and Abstracts Views on Vision4Press platform.
Data correspond to usage on the plateform after 2015. The current usage metrics is available 48-96 hours after online publication and is updated daily on week days.
Initial download of the metrics may take a while.