Fig. 7
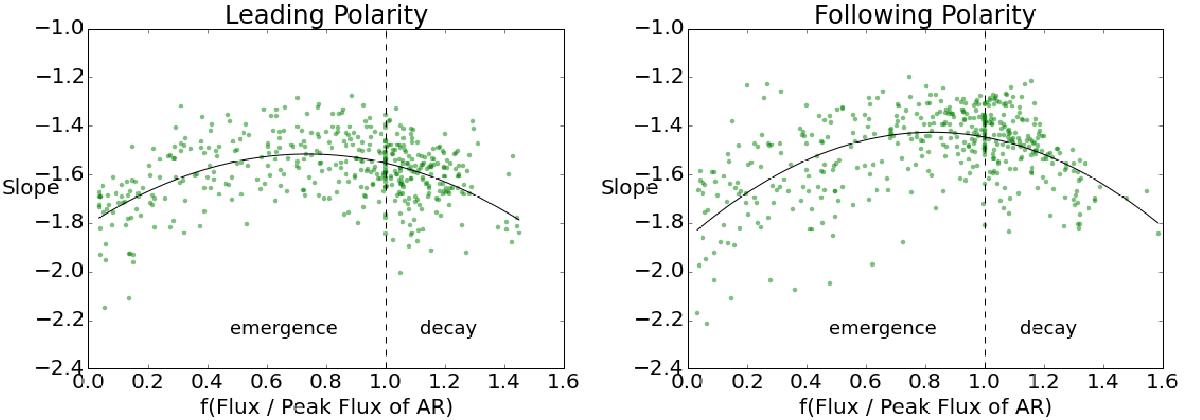
Similar to Fig. 5, this plot shows the evolution of the slope. Here, the slope is plotted against a function of the normalised magnetic flux. This normalised flux is defined as the ratio of the AR flux to the peak flux that region achieves. The peak flux and the ratios are found separately for the positive and negative magnetic polarities. To distinguish between emergence and decay phases, the function f(F), defined by Eq. (12), is used in abscissa. The emergence phase is in the range [0,1] and the decay phase is for abscissa >1. Second-order polynomials were least-squares fitted; they show the general trend.
Current usage metrics show cumulative count of Article Views (full-text article views including HTML views, PDF and ePub downloads, according to the available data) and Abstracts Views on Vision4Press platform.
Data correspond to usage on the plateform after 2015. The current usage metrics is available 48-96 hours after online publication and is updated daily on week days.
Initial download of the metrics may take a while.