Free Access
Fig. 6
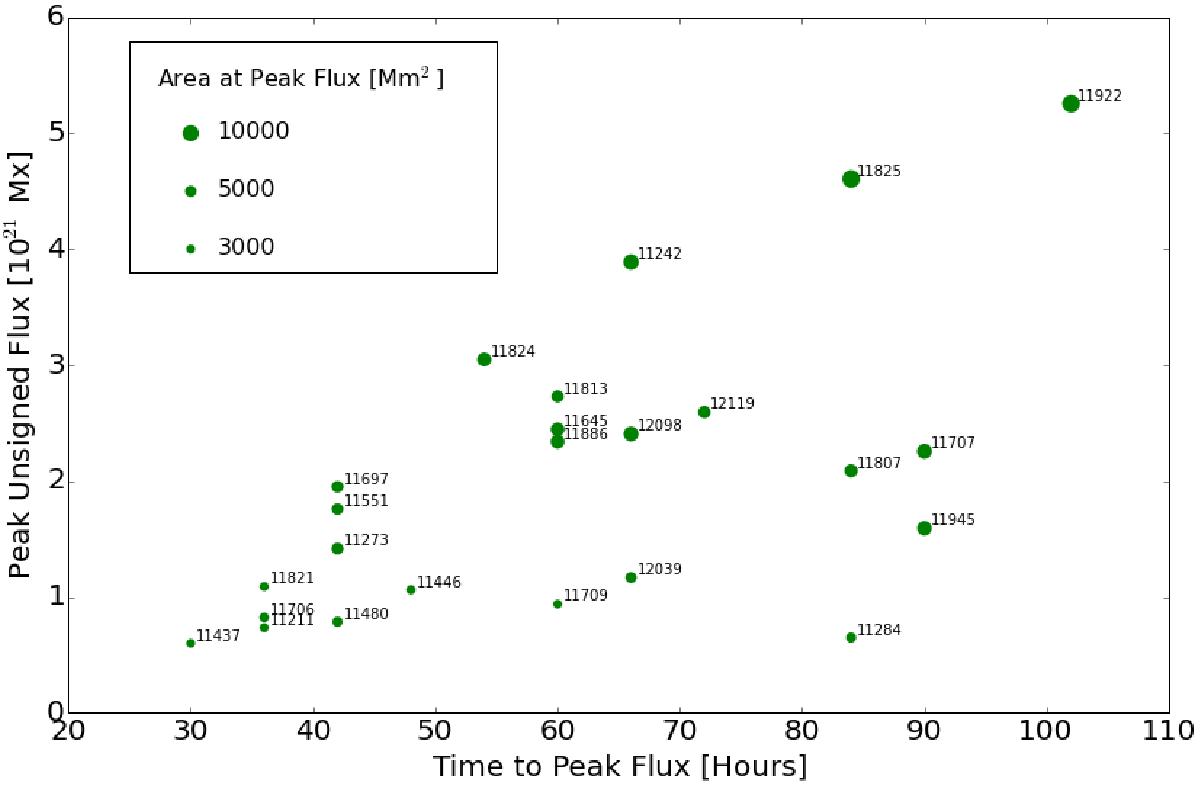
Peak unsigned flux reached by each AR plotted against the time it took to reach that value from the start of the emergence. The size of the points indicates the area covered by the region at that time. The points are labelled with their NOAA AR number.
Current usage metrics show cumulative count of Article Views (full-text article views including HTML views, PDF and ePub downloads, according to the available data) and Abstracts Views on Vision4Press platform.
Data correspond to usage on the plateform after 2015. The current usage metrics is available 48-96 hours after online publication and is updated daily on week days.
Initial download of the metrics may take a while.