Fig. 5
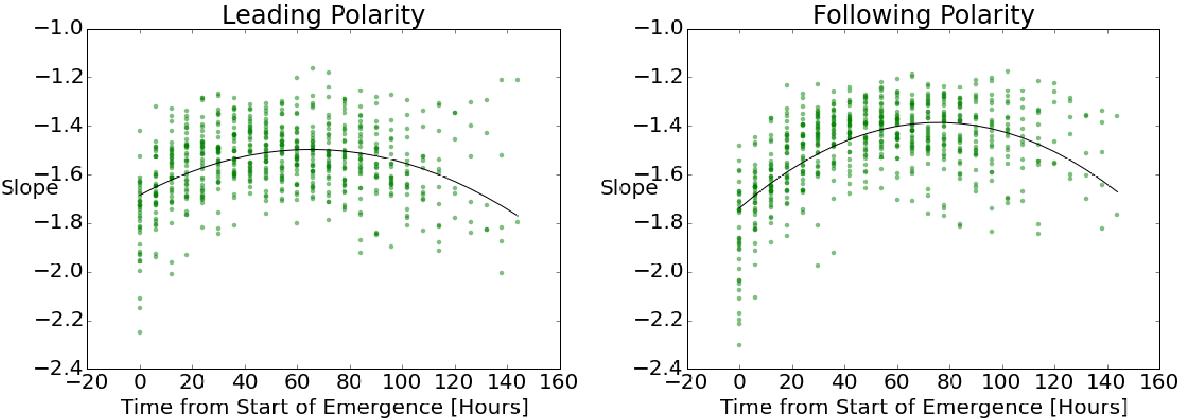
Slope of the best-fit straight line to the middle section of the log-log field distribution plot, calculated as illustrated in Fig. 4. This plot shows each slope value plotted against the age of the AR from the start of its emergence (t = 0) at each time step and for each AR. Data for leading and following sunspots were separated. Second-order polynomials were least-squares fitted; they show the general trend.
Current usage metrics show cumulative count of Article Views (full-text article views including HTML views, PDF and ePub downloads, according to the available data) and Abstracts Views on Vision4Press platform.
Data correspond to usage on the plateform after 2015. The current usage metrics is available 48-96 hours after online publication and is updated daily on week days.
Initial download of the metrics may take a while.