Fig. 3
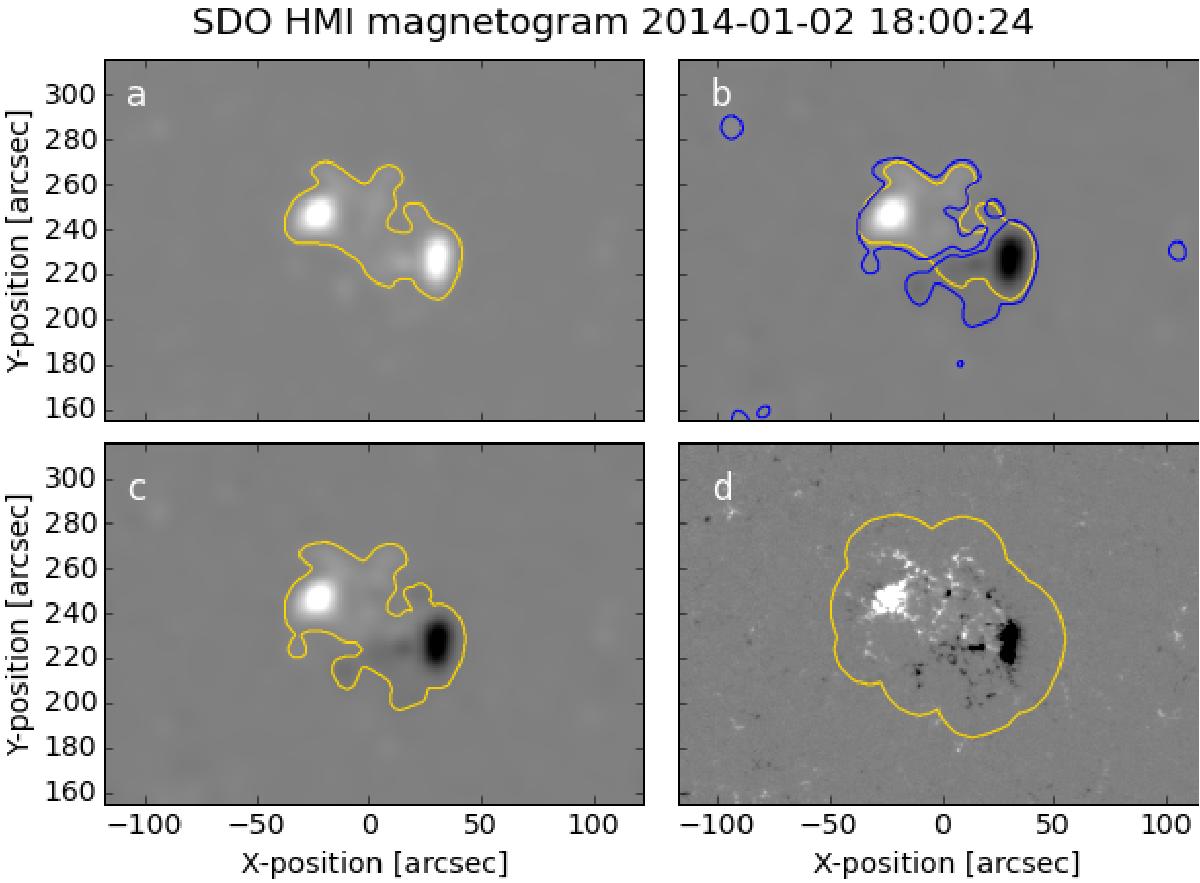
Example of the area selection and dilation procedure (Sect. 3.2) for NOAA AR 11945. Panel a) shows the selection >40 G in the blurred map of absolute field values. Panel b) shows the selection >20 G and <−20 G in the smoothed signed map (blue), along with the selection from panel a (yellow). Panel c) shows the selection after the field-dependent dilation, and panel d) the final region selection after the field-independent dilation.
Current usage metrics show cumulative count of Article Views (full-text article views including HTML views, PDF and ePub downloads, according to the available data) and Abstracts Views on Vision4Press platform.
Data correspond to usage on the plateform after 2015. The current usage metrics is available 48-96 hours after online publication and is updated daily on week days.
Initial download of the metrics may take a while.