Fig. 2
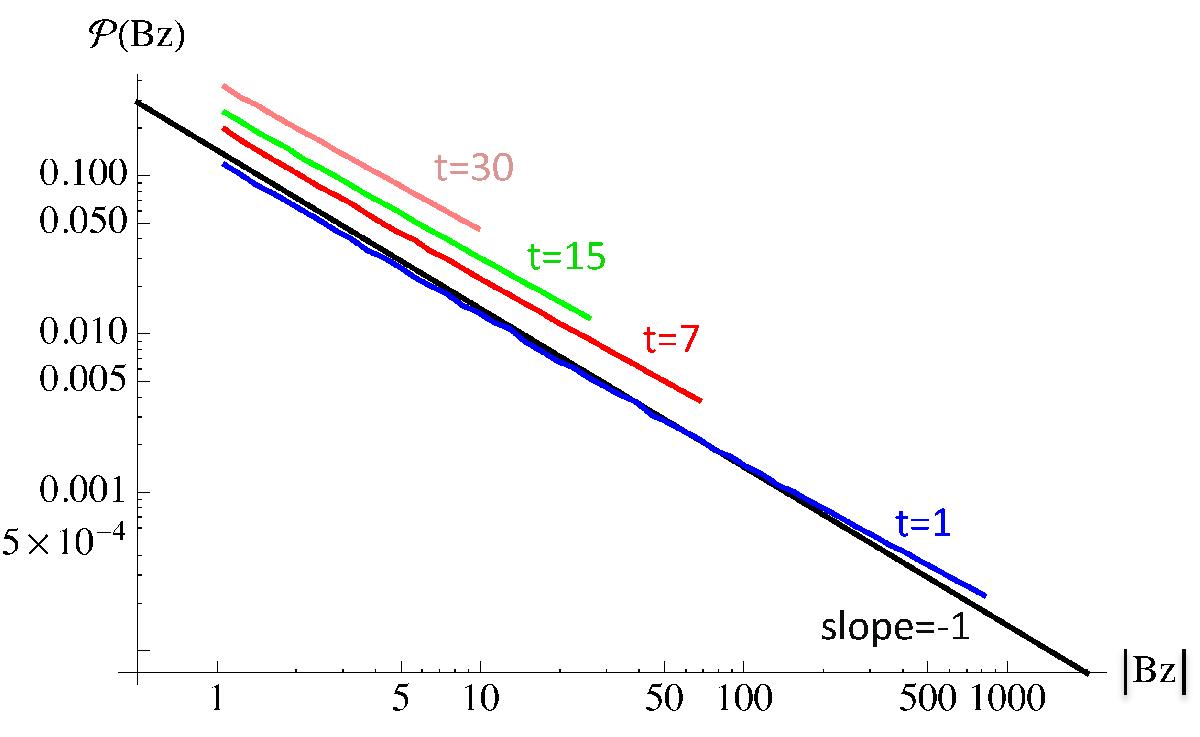
Log-log plot of the probability distribution of Bz versus Bz for a bipolar field diffusing with time. The Bz spatial distribution is described by Eq. (9). The time t is normalised by the initial time when R/a = 1 is selected (blue line). Only Bz> 1 is supposed to be detectable. The black straight line has a slope −1 for reference.
Current usage metrics show cumulative count of Article Views (full-text article views including HTML views, PDF and ePub downloads, according to the available data) and Abstracts Views on Vision4Press platform.
Data correspond to usage on the plateform after 2015. The current usage metrics is available 48-96 hours after online publication and is updated daily on week days.
Initial download of the metrics may take a while.