Fig. 11
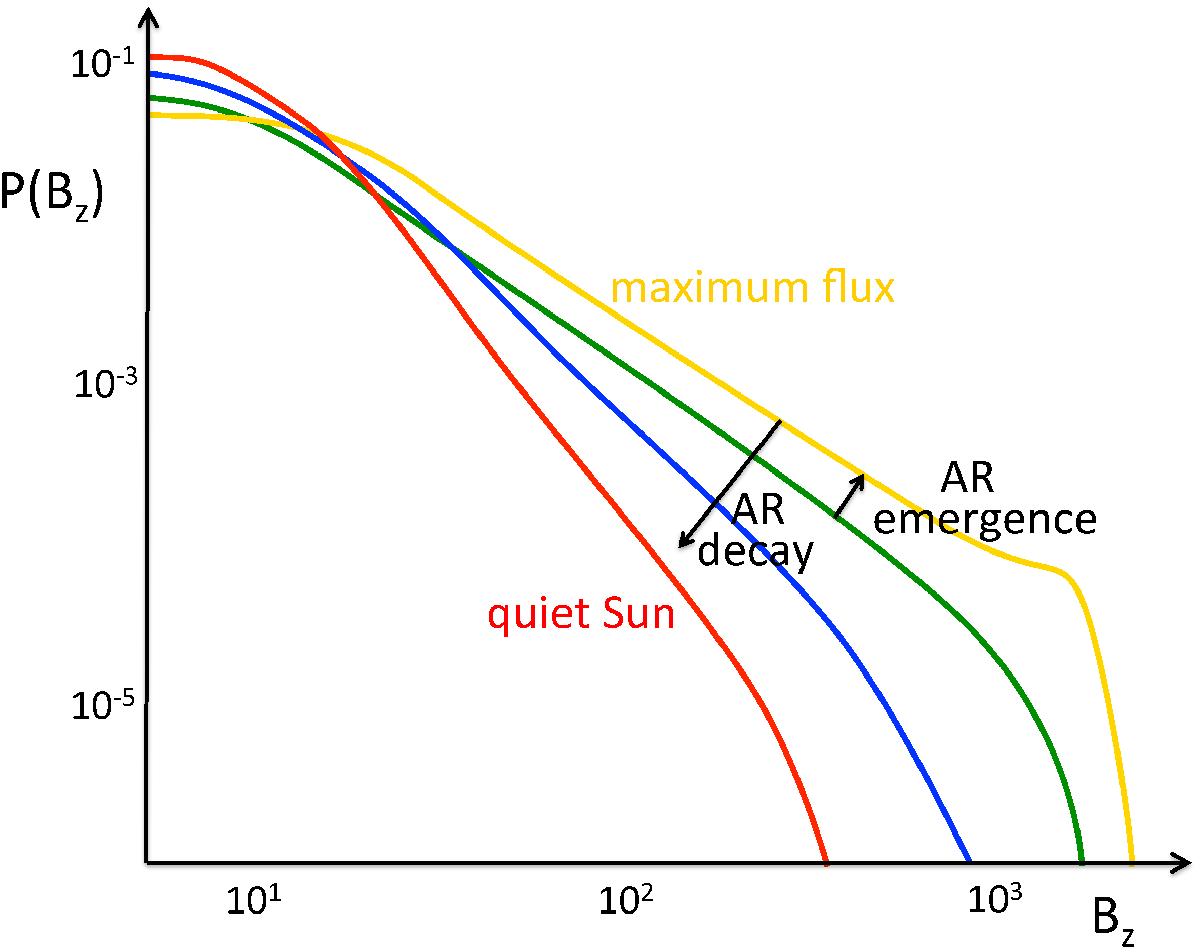
Schema summarising the evolution of the Bz distribution with a log-log plot. It shows the difference in the distribution between a newly emerging AR (green), one at around the time of peak flux (yellow), and one during the decay phase (blue). After this time, the field distribution of the AR evolves towards that of the quiet Sun (red). Since both magnetic polarities have very similar distributions at a given time (e.g., Figs. 4 and 8), they are not separated in this schema.
Current usage metrics show cumulative count of Article Views (full-text article views including HTML views, PDF and ePub downloads, according to the available data) and Abstracts Views on Vision4Press platform.
Data correspond to usage on the plateform after 2015. The current usage metrics is available 48-96 hours after online publication and is updated daily on week days.
Initial download of the metrics may take a while.