Fig. 1
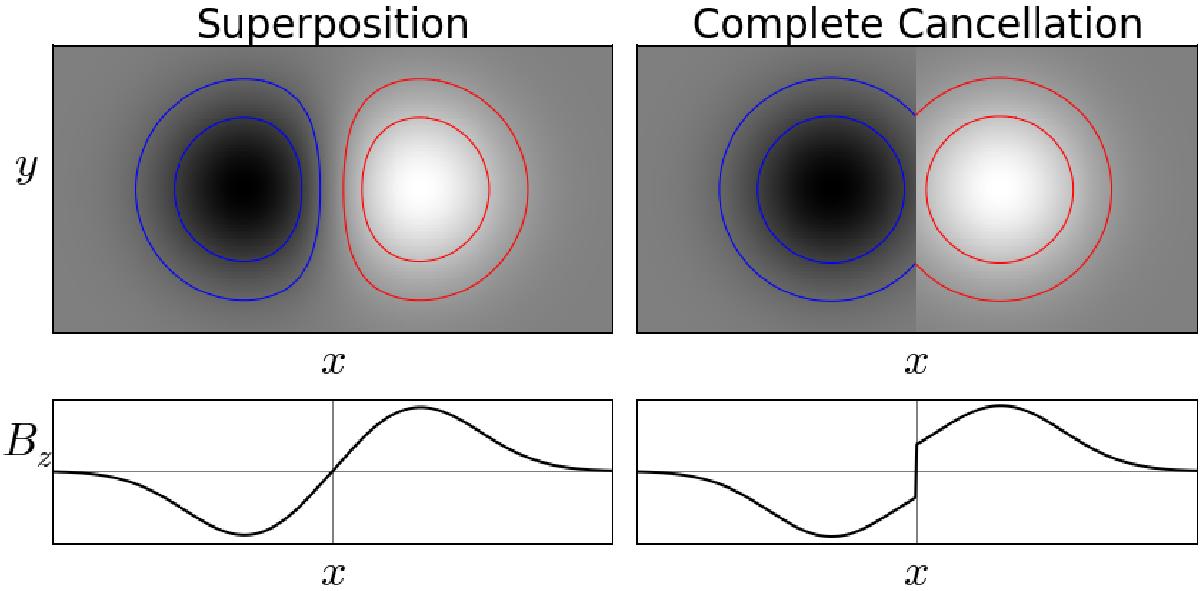
Two different scenarios for flux dispersion of a bipole as described in Sect. 2.3. The left-hand side of the plot shows superposition with no cancellation, and the right-hand side shows the case where complete cancellation occurs at x = 0. Two isocontours are also shown for the negative and positive spots. The two plots in the bottom row show a cross section of the magnetic field values taken at y = 0.
Current usage metrics show cumulative count of Article Views (full-text article views including HTML views, PDF and ePub downloads, according to the available data) and Abstracts Views on Vision4Press platform.
Data correspond to usage on the plateform after 2015. The current usage metrics is available 48-96 hours after online publication and is updated daily on week days.
Initial download of the metrics may take a while.