Fig. 8
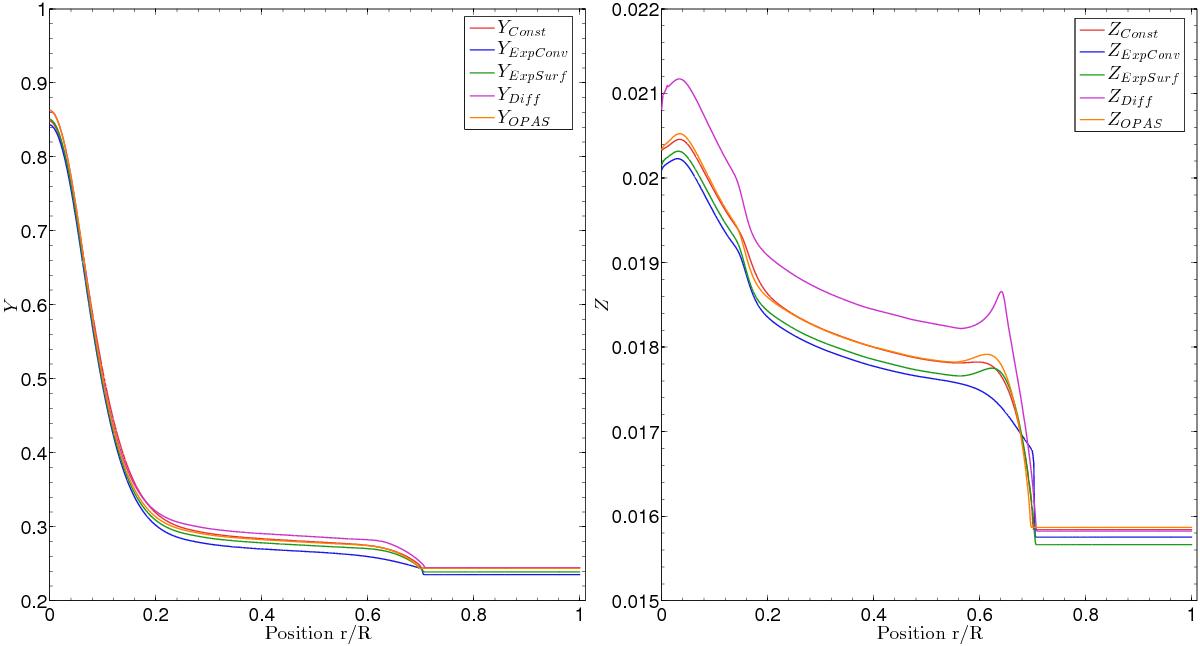
Left panel: helium abundance plot for three models with different implementations of turbulent diffusion. For the red curve, a constant mixing coefficient was applied throughout the structure and the evolution of the model. For the blue curve, we used an exponential decay starting from the base of the convective envelope of the model. For the green curve, we used an exponential decay starting from the surface of the model. For the magenta curve, we used a model including only microscopic diffusion. Right panel: the metallicity profiles of the three models described above.
Current usage metrics show cumulative count of Article Views (full-text article views including HTML views, PDF and ePub downloads, according to the available data) and Abstracts Views on Vision4Press platform.
Data correspond to usage on the plateform after 2015. The current usage metrics is available 48-96 hours after online publication and is updated daily on week days.
Initial download of the metrics may take a while.