Fig. 7
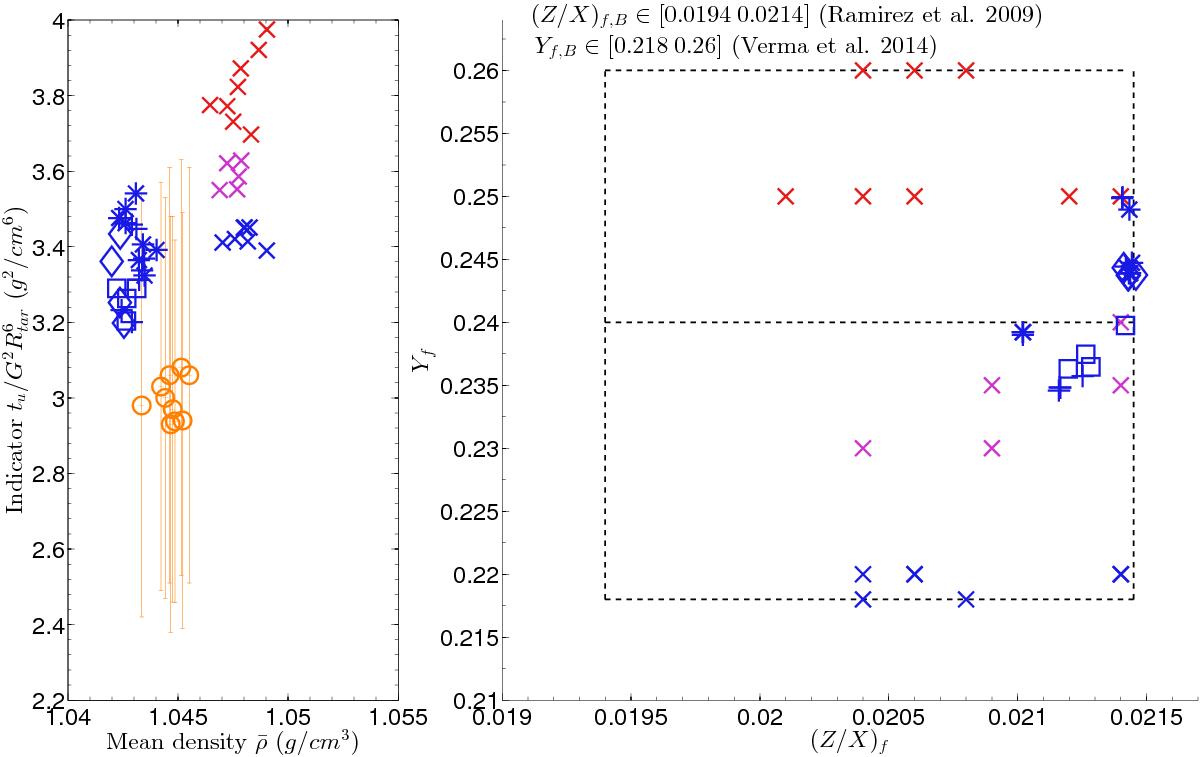
Left panel: mean density ![]() vs core conditions indicator (tu) plot. The inversion results are plotted in orange with their respective error bars. The × are values for the reference models computed with the Levenberg-Marquardt algorithm without extra mixing. The □ are related to models with a decaying exponential turbulent diffusion coefficient starting at the bottom of the convective enveloppe. The + show models with a decaying exponential diffusion coefficient starting from the surface and the ◇ use a constant turbulent diffusion coefficient. The ∗ depict models using the new OPAS opacities and the decaying exponential coefficient starting from the surface. Right panel: surface chemical composition box for 16CygB. The colour code allows direct trend comparisons between the surface chemical composition and the tu and
vs core conditions indicator (tu) plot. The inversion results are plotted in orange with their respective error bars. The × are values for the reference models computed with the Levenberg-Marquardt algorithm without extra mixing. The □ are related to models with a decaying exponential turbulent diffusion coefficient starting at the bottom of the convective enveloppe. The + show models with a decaying exponential diffusion coefficient starting from the surface and the ◇ use a constant turbulent diffusion coefficient. The ∗ depict models using the new OPAS opacities and the decaying exponential coefficient starting from the surface. Right panel: surface chemical composition box for 16CygB. The colour code allows direct trend comparisons between the surface chemical composition and the tu and ![]() values as in Fig. 3.
values as in Fig. 3.
Current usage metrics show cumulative count of Article Views (full-text article views including HTML views, PDF and ePub downloads, according to the available data) and Abstracts Views on Vision4Press platform.
Data correspond to usage on the plateform after 2015. The current usage metrics is available 48-96 hours after online publication and is updated daily on week days.
Initial download of the metrics may take a while.