Fig. 5
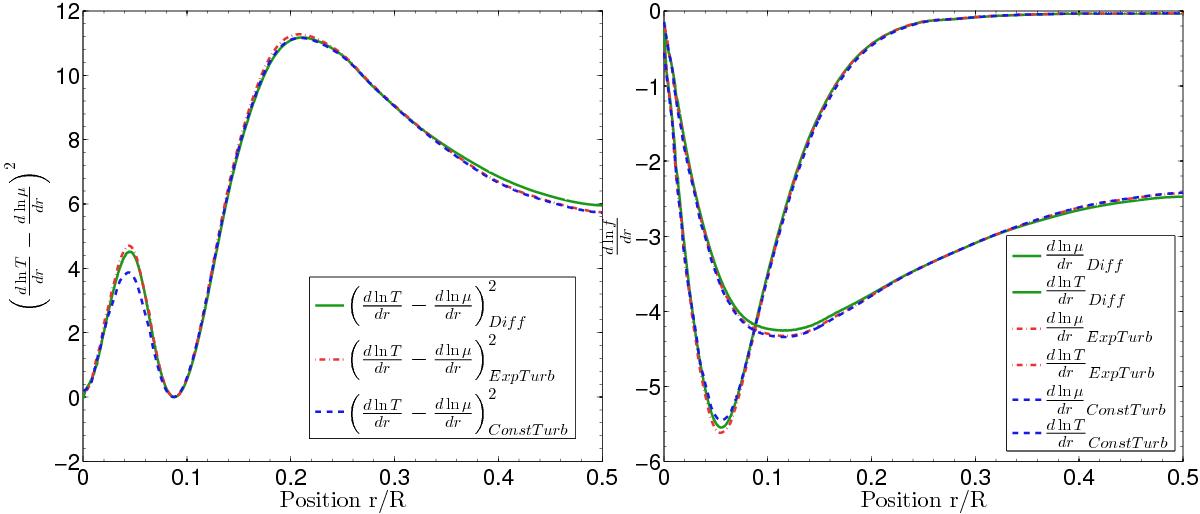
Left panel: plot showing the difference of the gradient of the natural logarithm of temperature (T) and that of the mean molecular weight (μ) for models including different mixing processes: the green curve is for a model with microscopic diffusion, the blue curve is for a model with a constant turbulent diffusion coefficient and the red curve is for an exponentially decaying turbulent diffusion coefficient. Right panel: the gradient of the natural logarithm of the mean molecular weight and of the temperature for the same models as in the left panel, the colour code has been respected.
Current usage metrics show cumulative count of Article Views (full-text article views including HTML views, PDF and ePub downloads, according to the available data) and Abstracts Views on Vision4Press platform.
Data correspond to usage on the plateform after 2015. The current usage metrics is available 48-96 hours after online publication and is updated daily on week days.
Initial download of the metrics may take a while.