Fig. 3
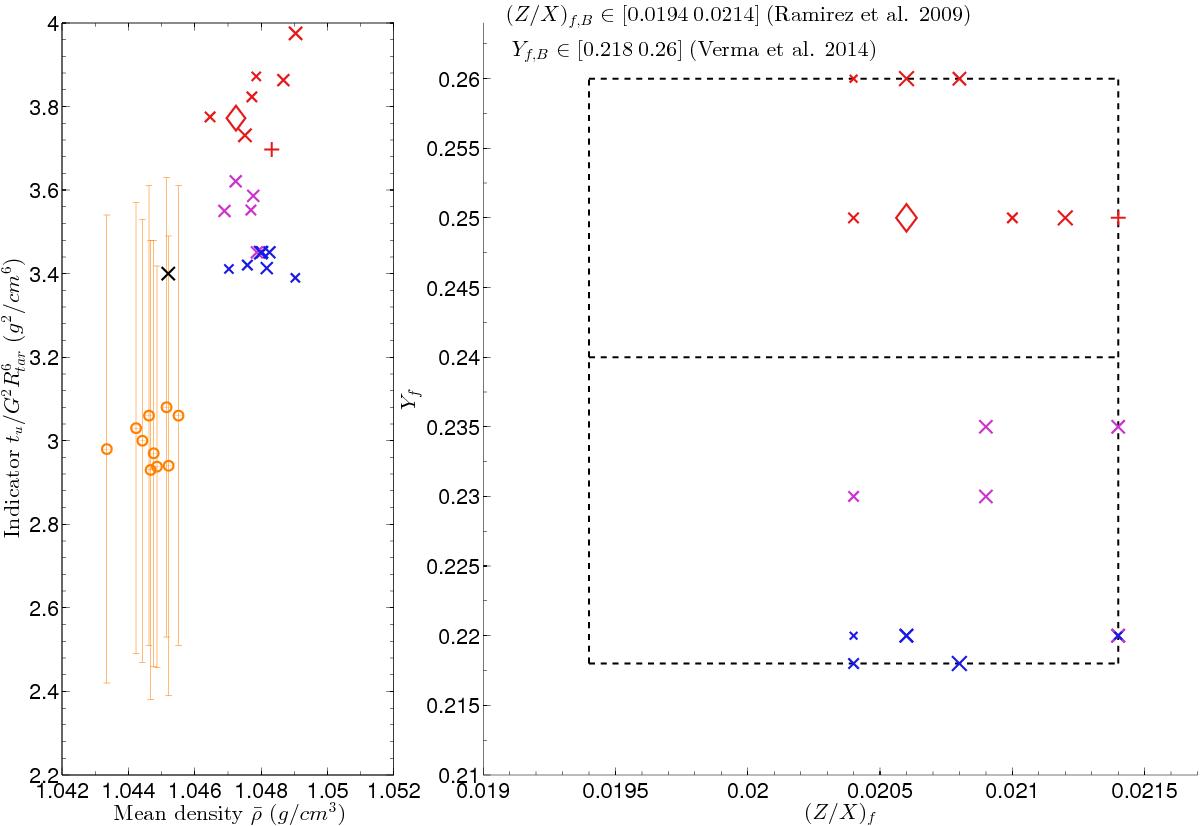
Left panel: mean density ![]() vs. core conditions indicator (tu) plot. The inversion results are plotted in orange with their respective error bars. The crosses are values for the reference models computed with the Levenberg-Marquardt algorithm with AGSS09, the black × shows one example of a model computed with GN93 and Yf = 0.25. Right panel: surface chemical composition box for 16CygB. The colour code used allows direct trend comparisons between the surface chemical composition and the tu values. The size of the symbols is related to the intensity of microscopic diffusion, the smaller the symbol, the smaller the D coefficient. The + and the ◇ illustrate the impact of the metallicity on the tu value.
vs. core conditions indicator (tu) plot. The inversion results are plotted in orange with their respective error bars. The crosses are values for the reference models computed with the Levenberg-Marquardt algorithm with AGSS09, the black × shows one example of a model computed with GN93 and Yf = 0.25. Right panel: surface chemical composition box for 16CygB. The colour code used allows direct trend comparisons between the surface chemical composition and the tu values. The size of the symbols is related to the intensity of microscopic diffusion, the smaller the symbol, the smaller the D coefficient. The + and the ◇ illustrate the impact of the metallicity on the tu value.
Current usage metrics show cumulative count of Article Views (full-text article views including HTML views, PDF and ePub downloads, according to the available data) and Abstracts Views on Vision4Press platform.
Data correspond to usage on the plateform after 2015. The current usage metrics is available 48-96 hours after online publication and is updated daily on week days.
Initial download of the metrics may take a while.