Free Access
Fig. 2
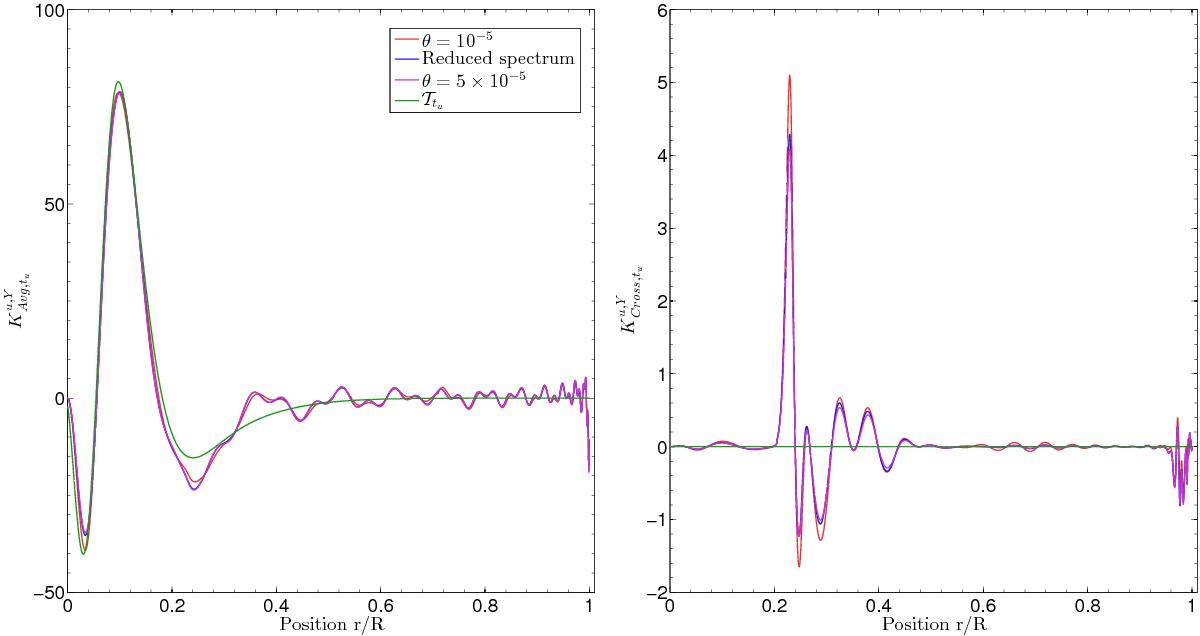
Left panel: averaging kernels for the core conditions indicator (tu) for various θ values and reduced frequency spectrum. Right panel: same figure for the cross-term kernels of the tu inversion. We used the (u,Y) structural pair in both plots.
Current usage metrics show cumulative count of Article Views (full-text article views including HTML views, PDF and ePub downloads, according to the available data) and Abstracts Views on Vision4Press platform.
Data correspond to usage on the plateform after 2015. The current usage metrics is available 48-96 hours after online publication and is updated daily on week days.
Initial download of the metrics may take a while.