Fig. 1
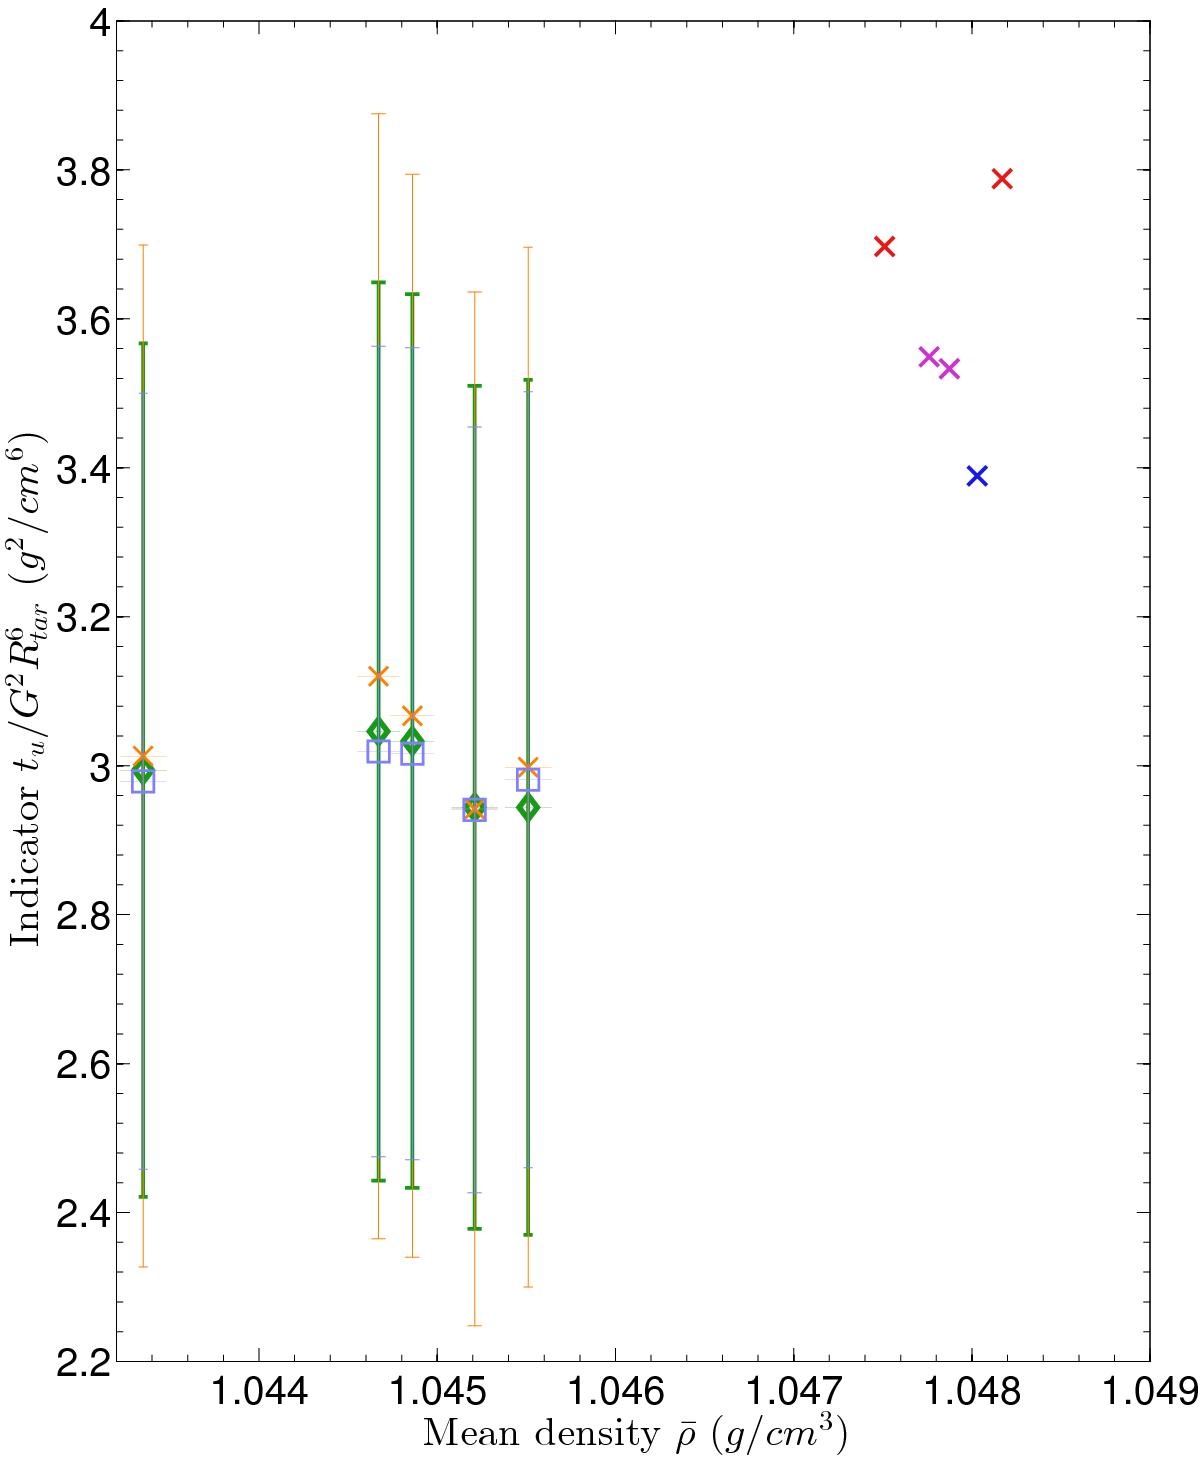
In orange, inversion results for the tu indicator and ![]() with the full set of modes for 16CygB. In green, inversion results for the same models excluding the modes with the largest error bars in the frequency set. The blue squares are associated with inversion results for which the trade-off parameter θ has been slightly enhanced. In red, blue and magenta, tu and
with the full set of modes for 16CygB. In green, inversion results for the same models excluding the modes with the largest error bars in the frequency set. The blue squares are associated with inversion results for which the trade-off parameter θ has been slightly enhanced. In red, blue and magenta, tu and ![]() values in the reference models (See text for the explanation of the colour code).
values in the reference models (See text for the explanation of the colour code).
Current usage metrics show cumulative count of Article Views (full-text article views including HTML views, PDF and ePub downloads, according to the available data) and Abstracts Views on Vision4Press platform.
Data correspond to usage on the plateform after 2015. The current usage metrics is available 48-96 hours after online publication and is updated daily on week days.
Initial download of the metrics may take a while.