Fig. 8
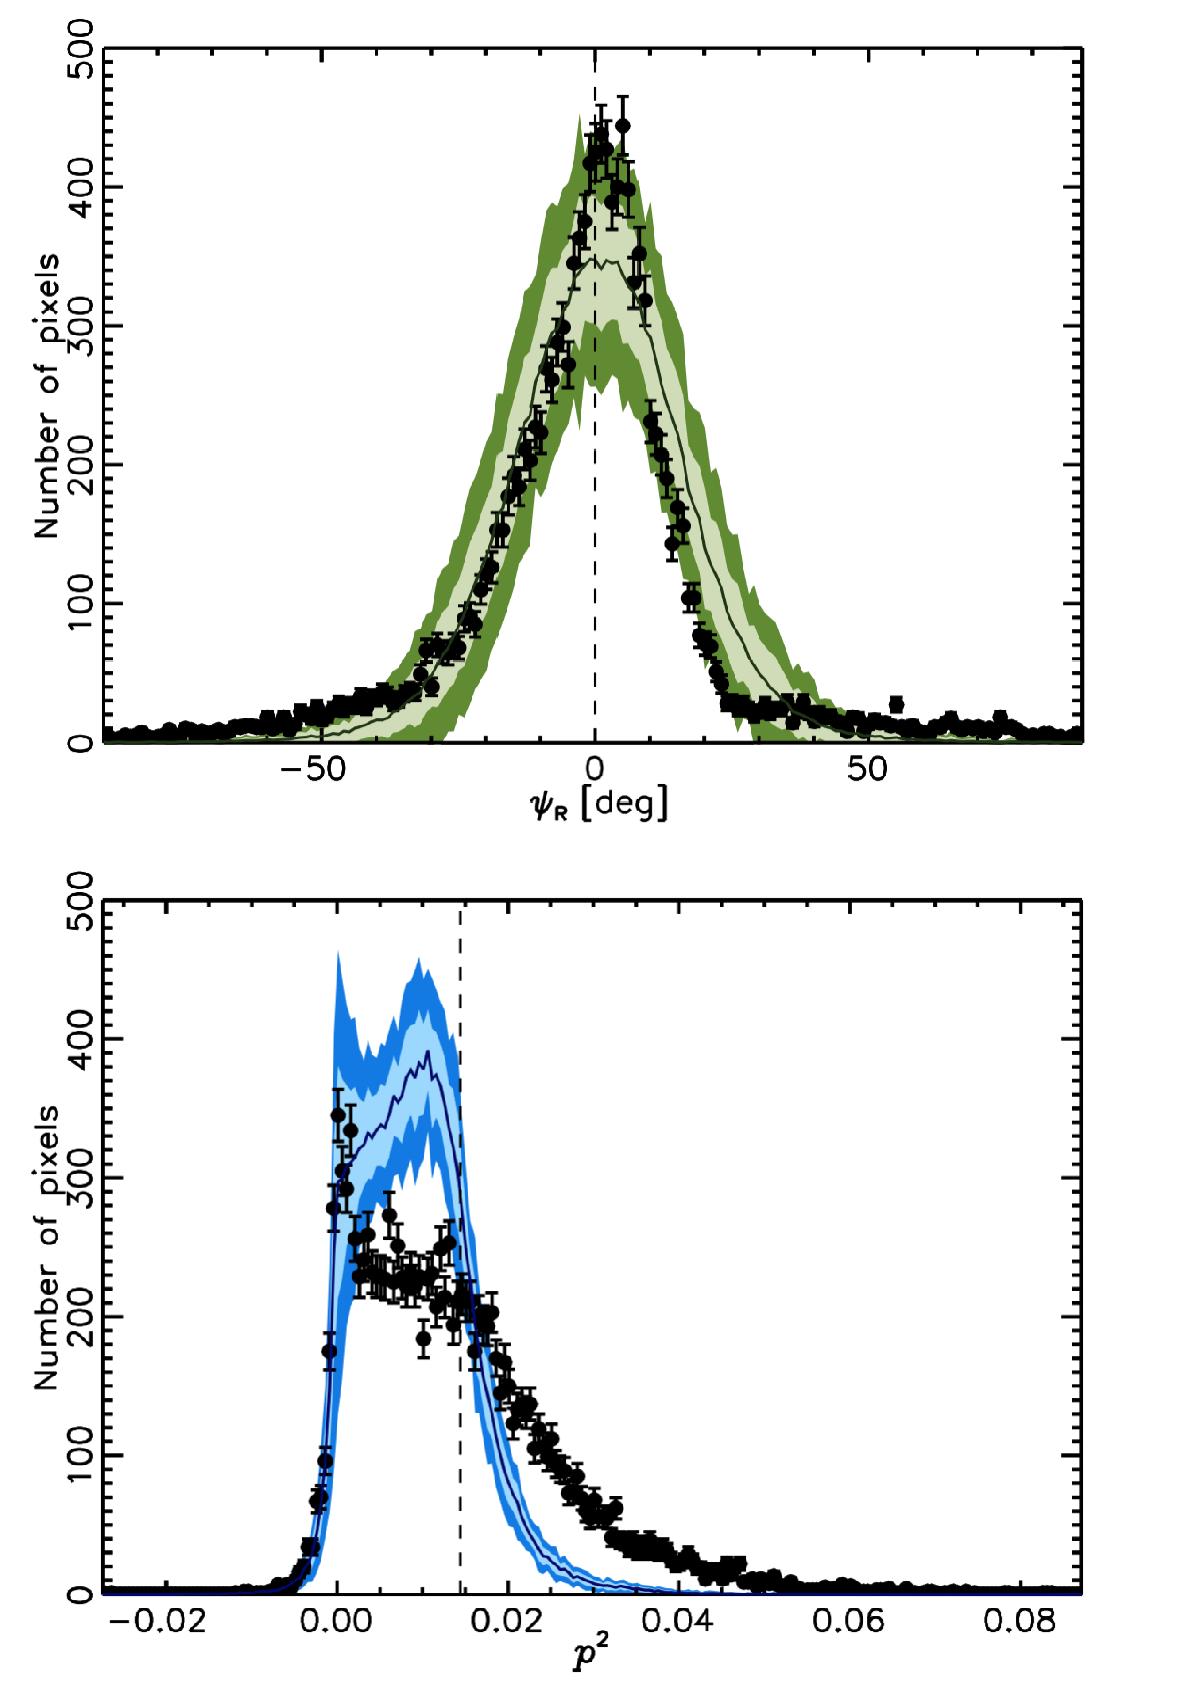
Results of step B. Top: histogram of ψR, the polarization angle inferred from the Stokes parameters rotated with respect to the best-fit uniform direction of the GMF (![]() and
and ![]() ), over the southern Galactic cap (black dots). The error bars represent the Poisson noise within each bin of the histogram. The green line represents the mean of the step B results for fM = 0.4 over 20 different realizations. The green shaded regions correspond to ± 1σ (light green) and ± 2σ (dark green) variations of the model. Bottom: histogram of p2 obtained when combining the Year 1 and Year 2 maps (black dots). The error bars here represent the Poisson noise within each bin of the histogram. Step B is now shown in blue. The dashed vertical line corresponds to a value of the polarization fraction of 12%.
), over the southern Galactic cap (black dots). The error bars represent the Poisson noise within each bin of the histogram. The green line represents the mean of the step B results for fM = 0.4 over 20 different realizations. The green shaded regions correspond to ± 1σ (light green) and ± 2σ (dark green) variations of the model. Bottom: histogram of p2 obtained when combining the Year 1 and Year 2 maps (black dots). The error bars here represent the Poisson noise within each bin of the histogram. Step B is now shown in blue. The dashed vertical line corresponds to a value of the polarization fraction of 12%.
Current usage metrics show cumulative count of Article Views (full-text article views including HTML views, PDF and ePub downloads, according to the available data) and Abstracts Views on Vision4Press platform.
Data correspond to usage on the plateform after 2015. The current usage metrics is available 48-96 hours after online publication and is updated daily on week days.
Initial download of the metrics may take a while.