Fig. 13
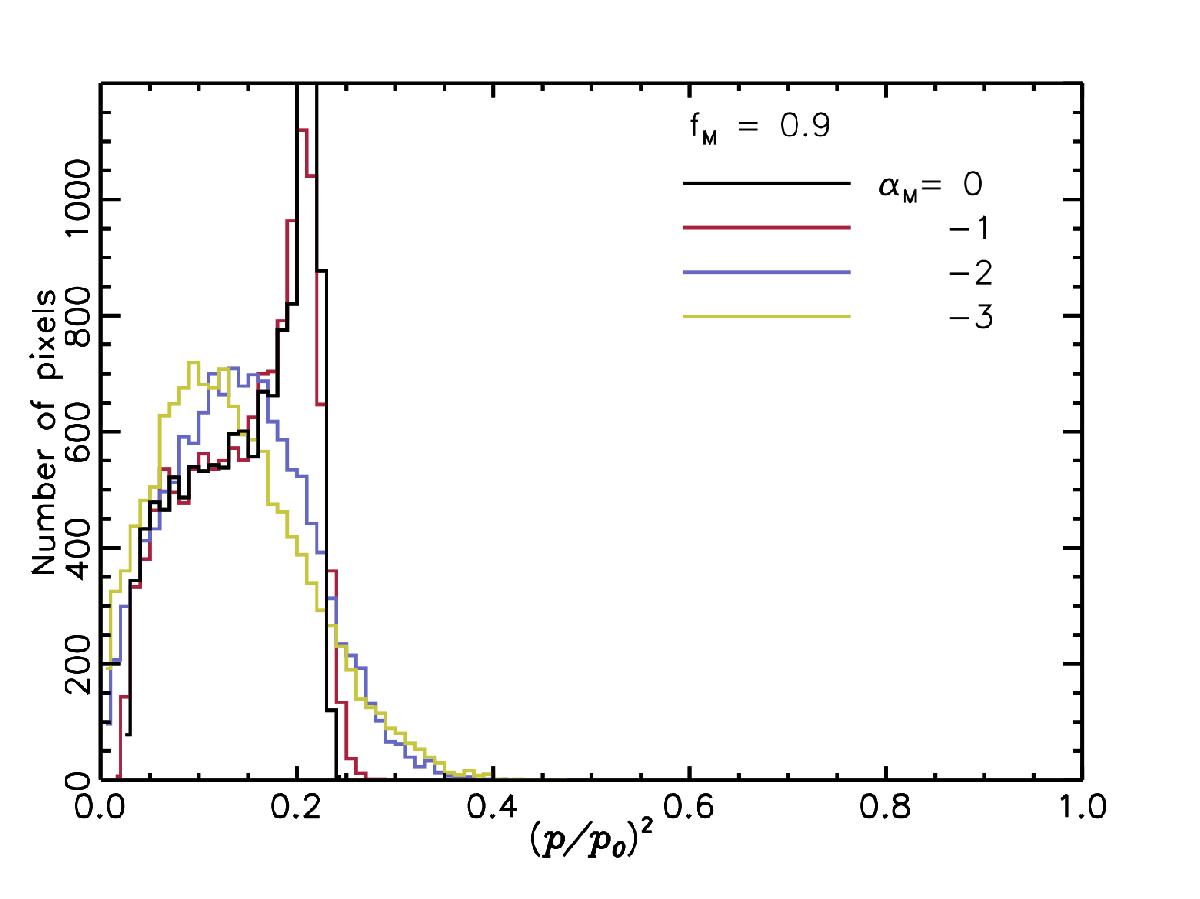
Model histograms of p2 normalized to unity with p0, obtained for a continuously varying GMF orientation along the LOS, with fM = 0.9 for several values of α, between 0 (black curve) and −3 (yellow curve). To facilitate the comparison of the histogram of (p/p0)2 with that in Fig. 12, we have used the same bin width (0.01) to compute both histograms.
Current usage metrics show cumulative count of Article Views (full-text article views including HTML views, PDF and ePub downloads, according to the available data) and Abstracts Views on Vision4Press platform.
Data correspond to usage on the plateform after 2015. The current usage metrics is available 48-96 hours after online publication and is updated daily on week days.
Initial download of the metrics may take a while.