Fig. 5
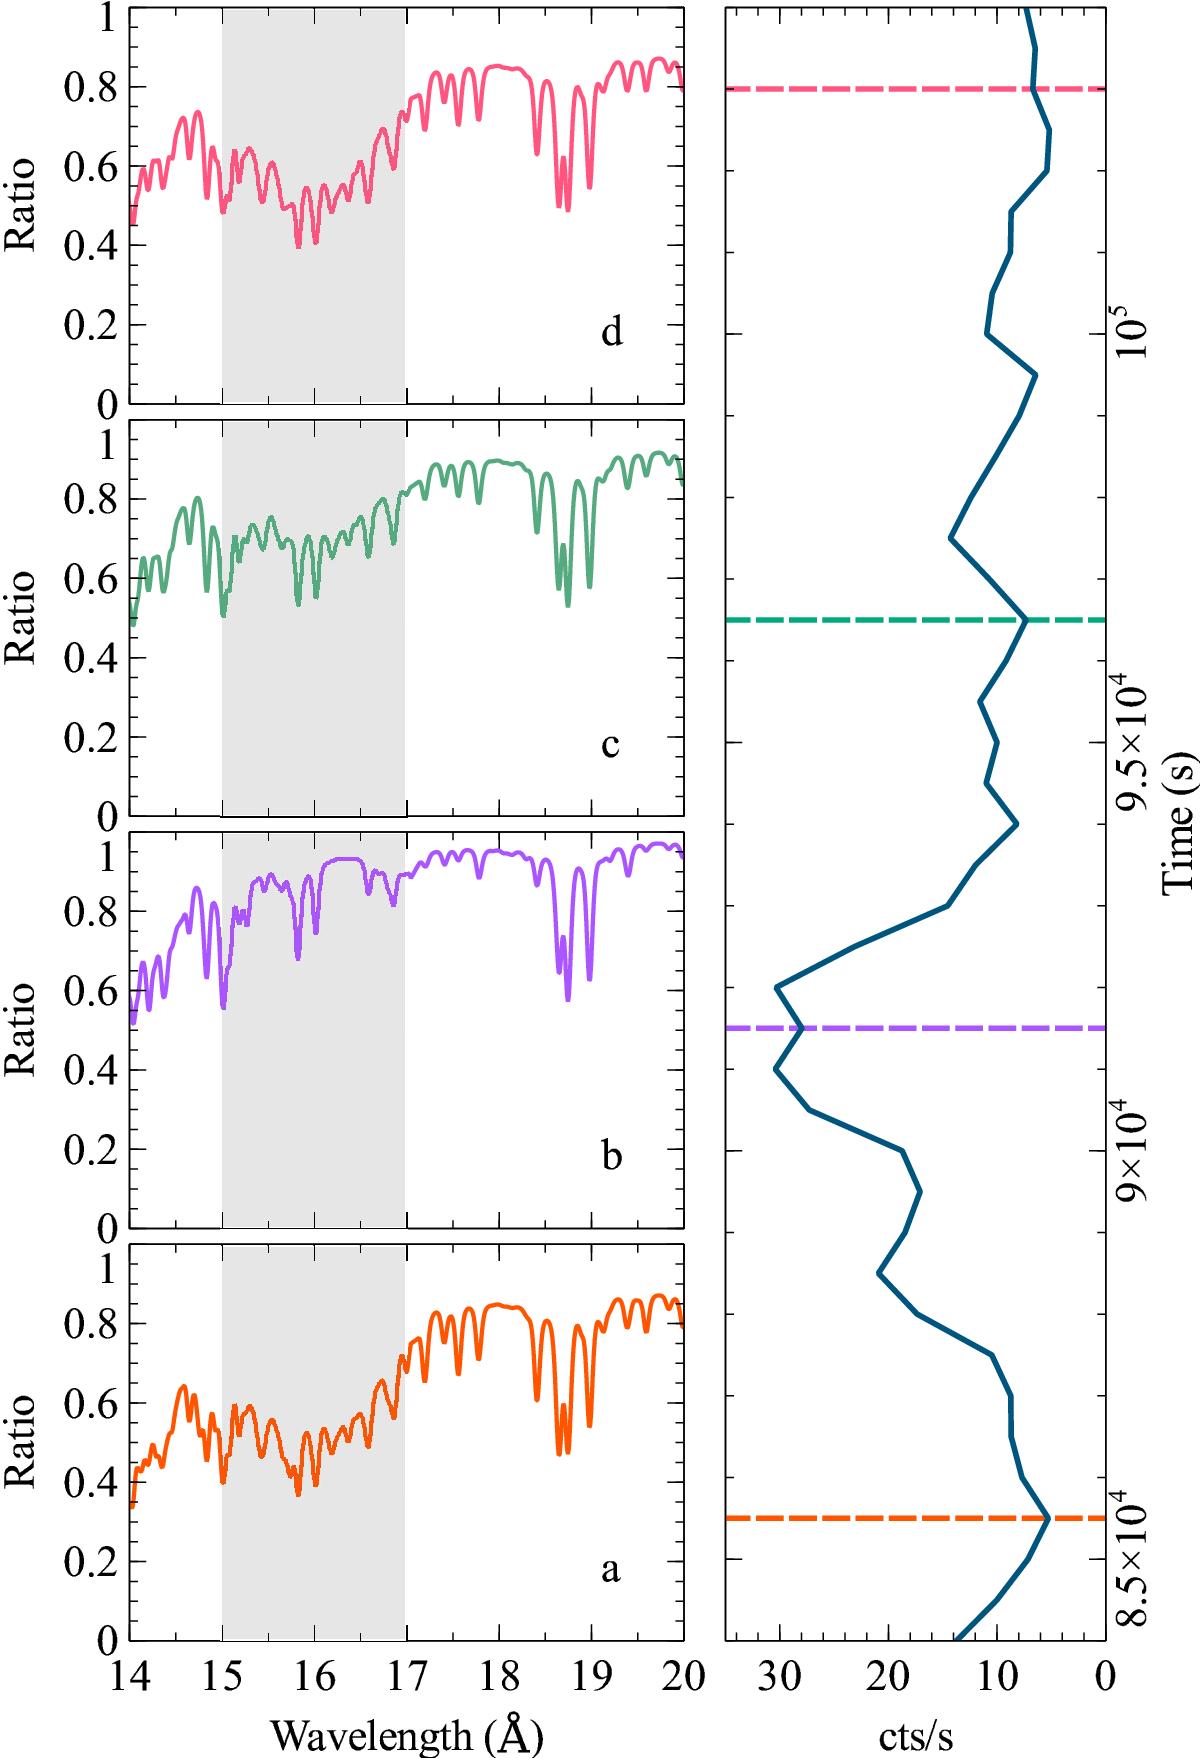
Left panel: data/continuum model ratio of the simulated RGS spectra for r = 1015.75 cm around the region of the Fe UTA complex (15−17 Å, gray area in the spectra) for distinct time steps indicated by the dashed lines on the right. Right panel: slice of the generated light curves from the simulated spectra, which includes the time steps of the spectra in the left. We note that spectra a), c) and d) have approximately the same flux level but show different absorption features, which indicates the dependence of the warm absorber on the flux variation history.
Current usage metrics show cumulative count of Article Views (full-text article views including HTML views, PDF and ePub downloads, according to the available data) and Abstracts Views on Vision4Press platform.
Data correspond to usage on the plateform after 2015. The current usage metrics is available 48-96 hours after online publication and is updated daily on week days.
Initial download of the metrics may take a while.