Free Access
Fig. 4
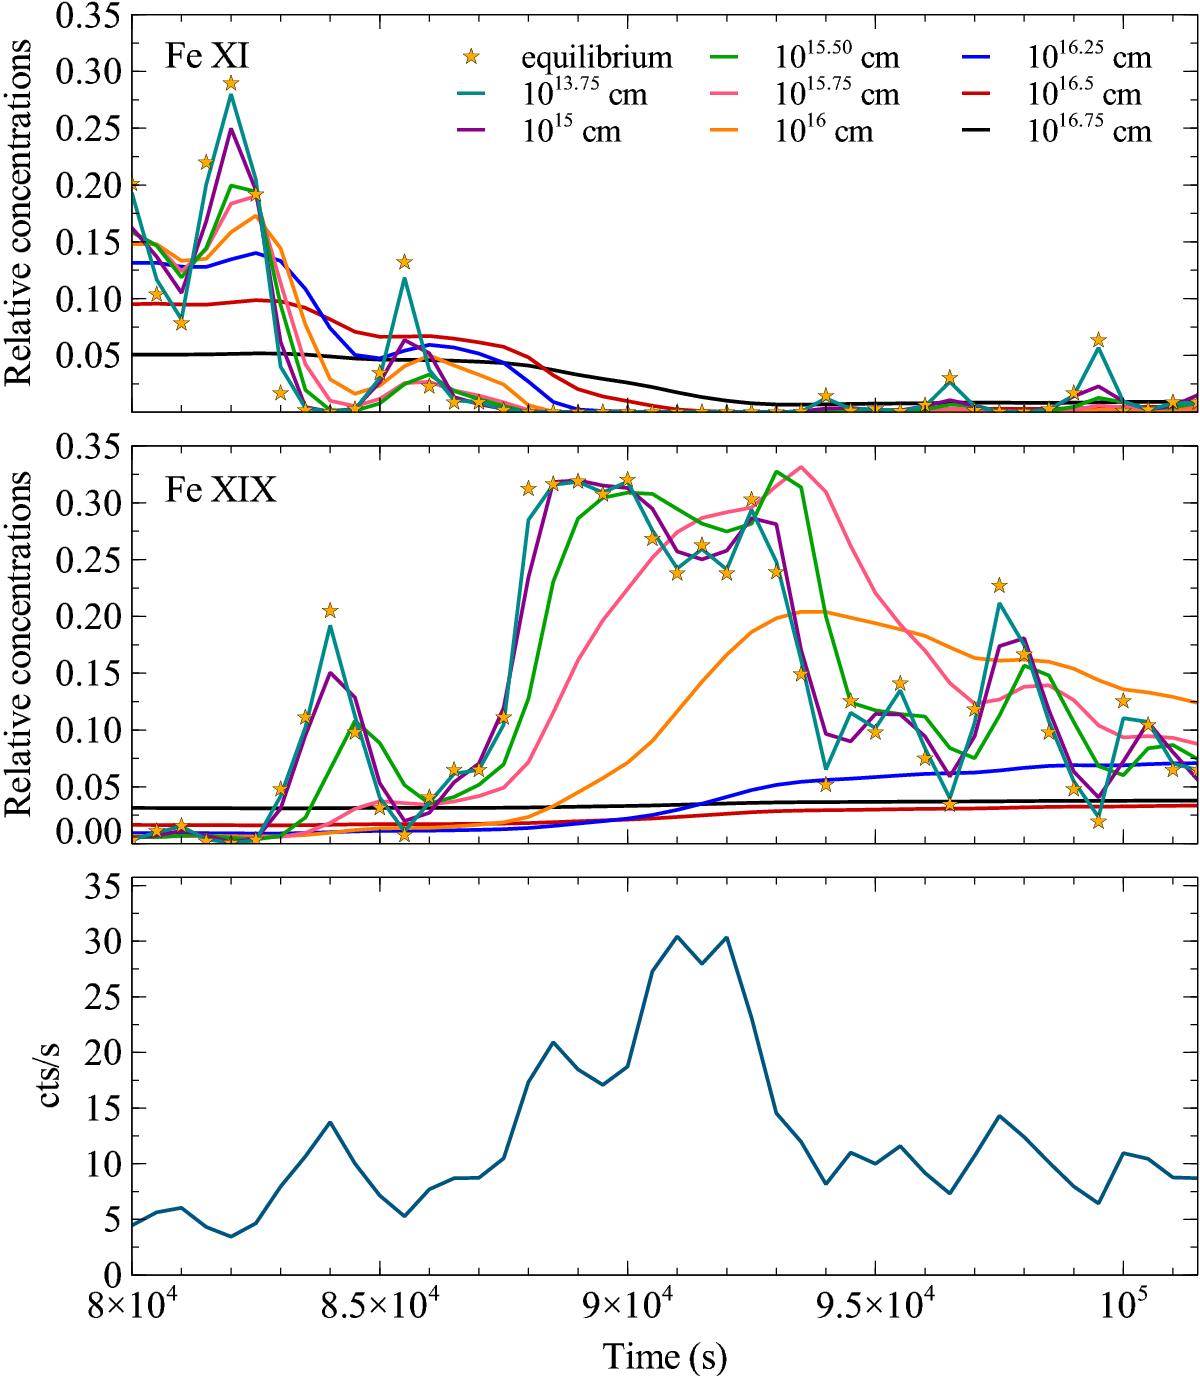
Time-dependent evolution of the relative concentrations of Fe xi (upper panel) and Fe xix (middle panel) responding to changes in the ionizing continuum (lower panel) for different distances of gas component 1 (see Table 1) from the ionizing source.
Current usage metrics show cumulative count of Article Views (full-text article views including HTML views, PDF and ePub downloads, according to the available data) and Abstracts Views on Vision4Press platform.
Data correspond to usage on the plateform after 2015. The current usage metrics is available 48-96 hours after online publication and is updated daily on week days.
Initial download of the metrics may take a while.