Fig. 11
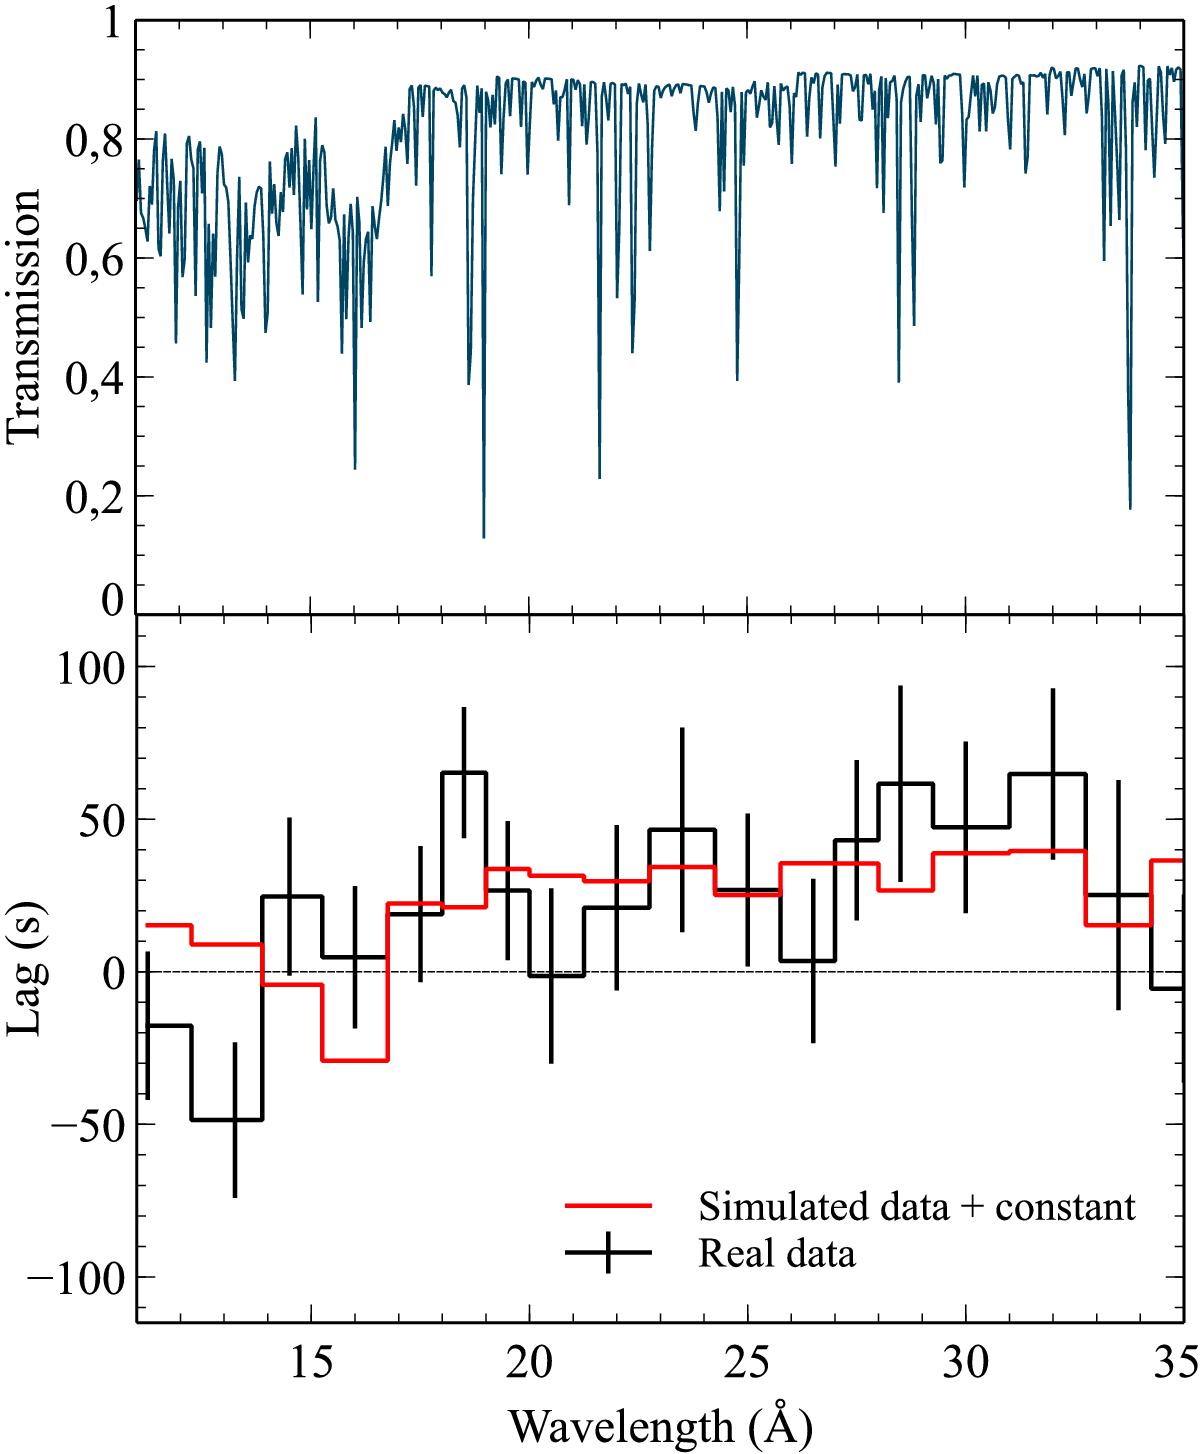
Warm absorber transmission model (top) and lag-energy spectrum (bottom). The lag-energy spectrum from simulated data, at r = 1015.75 cm (see Fig. 8) with an additive constant of 49.1 s, was fitted to the observed lag-energy spectrum, plotted in black, to obtain a χ2 of 20.7 for 17 d.o.f. The simulated lag-energy spectrum with an offset, corresponding to the constant that resulted from the fit (~50 s), is overplotted in red. The reference band to compute the lag-energy spectrum is a broad EPIC-pn band (1.5−10 keV). We note that a negative lag indicates a soft lag, which means that the band of interest lags the broad reference band. This helps to easily match the lag-energy spectrum to the absorption features in the energy spectrum.
Current usage metrics show cumulative count of Article Views (full-text article views including HTML views, PDF and ePub downloads, according to the available data) and Abstracts Views on Vision4Press platform.
Data correspond to usage on the plateform after 2015. The current usage metrics is available 48-96 hours after online publication and is updated daily on week days.
Initial download of the metrics may take a while.