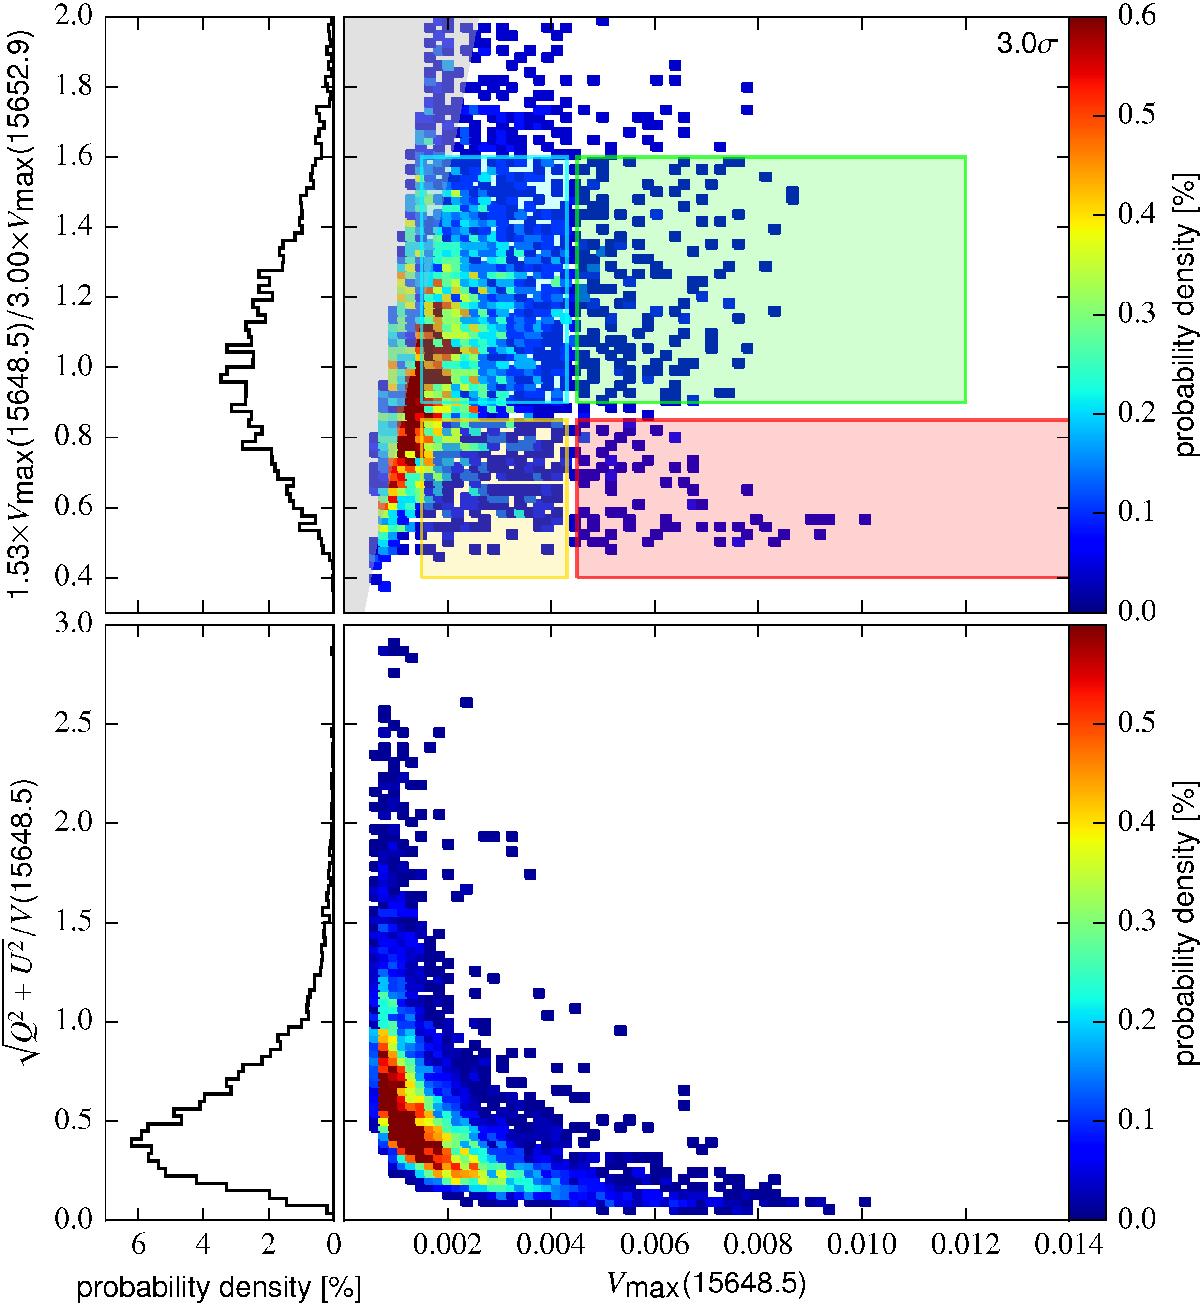
Fig. 7
Top panel: magnetic line ratio (MLR) of the GRIS data set as a function of the Stokes V amplitude Vmax in Fe i 15 648.5 Å. The two-dimensional histogram takes only two-lobed profiles with small asymmetries (δa and δA) into account. Left panel: histogram integrated over the x-axis of the scatter plot. The color-coded boxes mark regions discussed in the text, the gray wedge indicates the 3σ threshold applied to compute the number of lobes. Bottom panel: same as above, but for the LP/CP ratio in the Fe i 15 648.5 Å line (see Sect. 5.1).
Current usage metrics show cumulative count of Article Views (full-text article views including HTML views, PDF and ePub downloads, according to the available data) and Abstracts Views on Vision4Press platform.
Data correspond to usage on the plateform after 2015. The current usage metrics is available 48-96 hours after online publication and is updated daily on week days.
Initial download of the metrics may take a while.