Free Access
Fig. 4
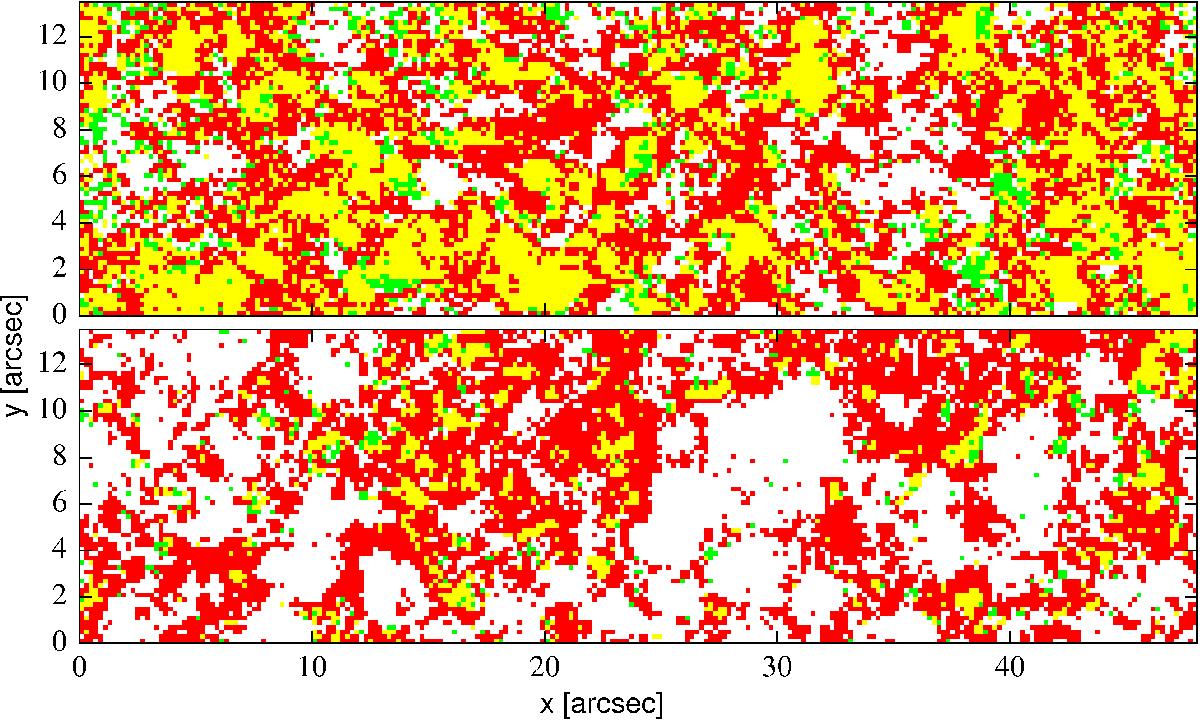
Signal-to-noise ratio comparison between the GRIS (top panel) and SOT/SP (bottom panel) quiet-Sun scans. Red, green, and yellow pixels indicate where the CP, LP, or both signals are above the 3σ level, respectively.
Current usage metrics show cumulative count of Article Views (full-text article views including HTML views, PDF and ePub downloads, according to the available data) and Abstracts Views on Vision4Press platform.
Data correspond to usage on the plateform after 2015. The current usage metrics is available 48-96 hours after online publication and is updated daily on week days.
Initial download of the metrics may take a while.