Fig. 14
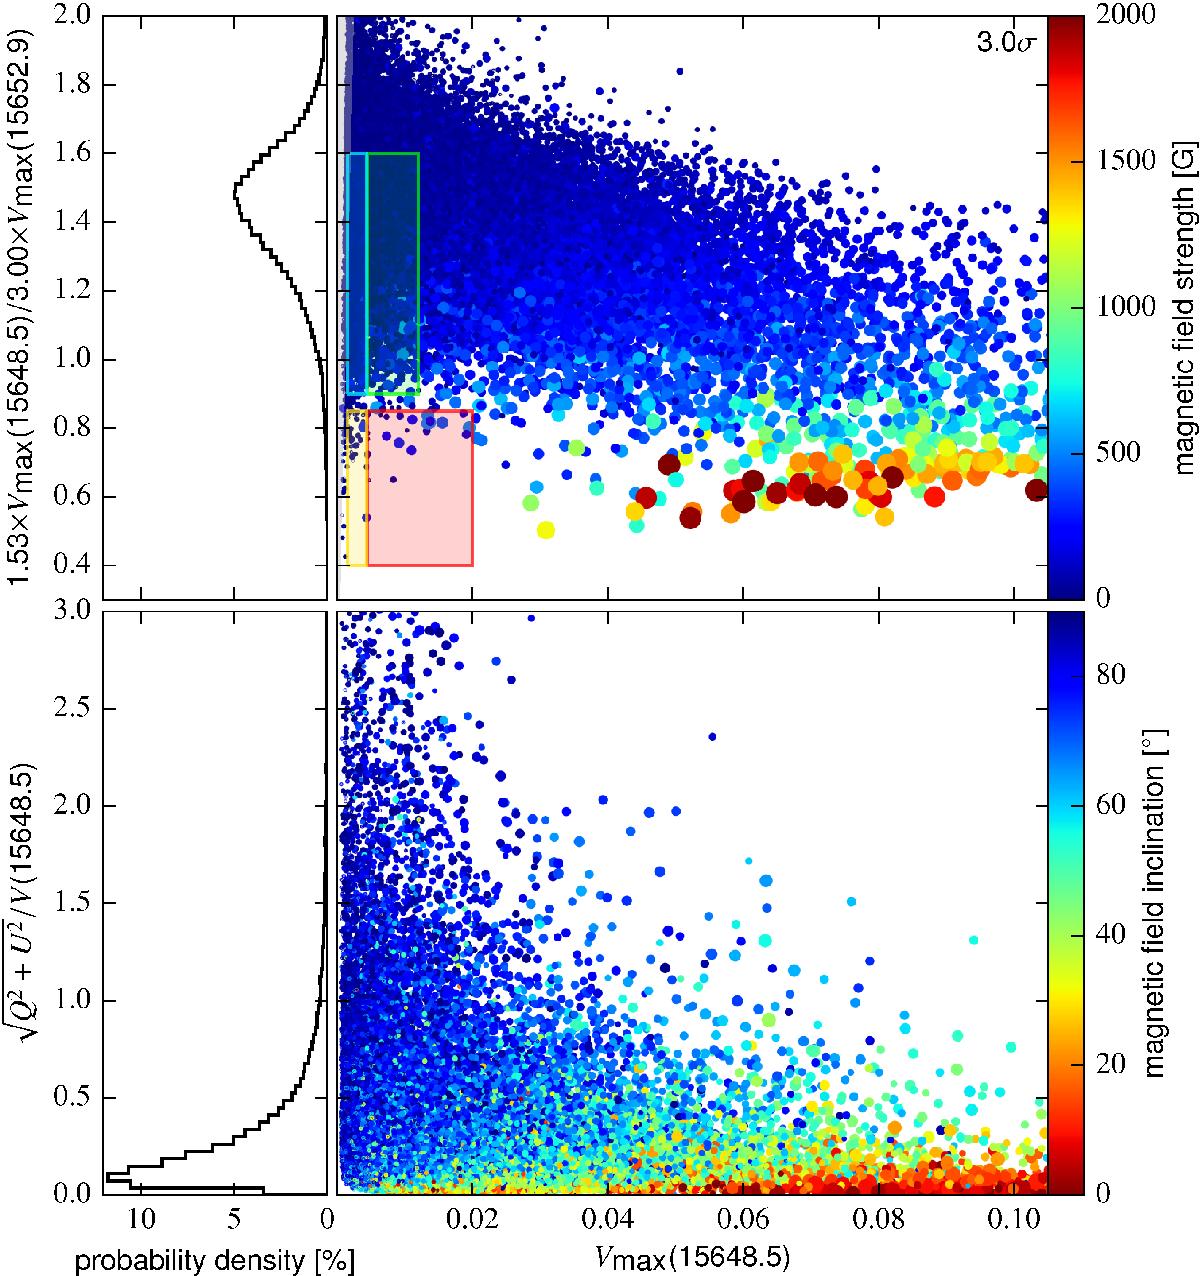
MLR (top panel) and LP/CP (bottom panel) as a function of Vmax in Fe i 15 648.5 Å, computed from the undegraded MHD Stokes profiles. Similar to Fig. 11, the color coding represents the magnetic field strength and the inclination angle, respectively, averaged over log τ = (−0.2,−0.8) in the undegraded MHD cube. The colored boxes in the top panel mark the same MLR regions as in Figs. 7 and 11.
Current usage metrics show cumulative count of Article Views (full-text article views including HTML views, PDF and ePub downloads, according to the available data) and Abstracts Views on Vision4Press platform.
Data correspond to usage on the plateform after 2015. The current usage metrics is available 48-96 hours after online publication and is updated daily on week days.
Initial download of the metrics may take a while.