Fig. 13
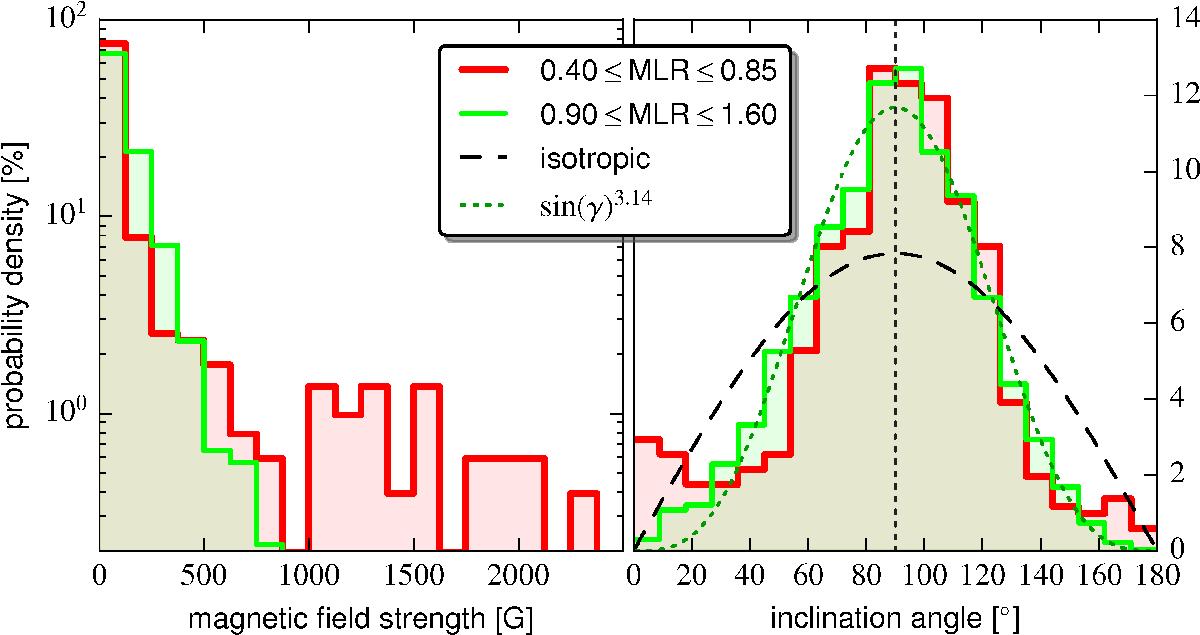
Probability distribution for the magnetic field strength (left, logarithmic y-scale) and inclination (right, linear y-scale) from the MHD simulations (binned to the GRIS pixel size), in red for low MLR values (red and yellow boxes in Fig. 11), and in green for high MLR values (blue and green boxes in Fig. 11). The dashed line in the right panel indicates an isotropic distribution, the dotted line is a fit to the high MLR distribution (green) with the functional form sin(γ)a with a = 3.67.
Current usage metrics show cumulative count of Article Views (full-text article views including HTML views, PDF and ePub downloads, according to the available data) and Abstracts Views on Vision4Press platform.
Data correspond to usage on the plateform after 2015. The current usage metrics is available 48-96 hours after online publication and is updated daily on week days.
Initial download of the metrics may take a while.