Fig. 12
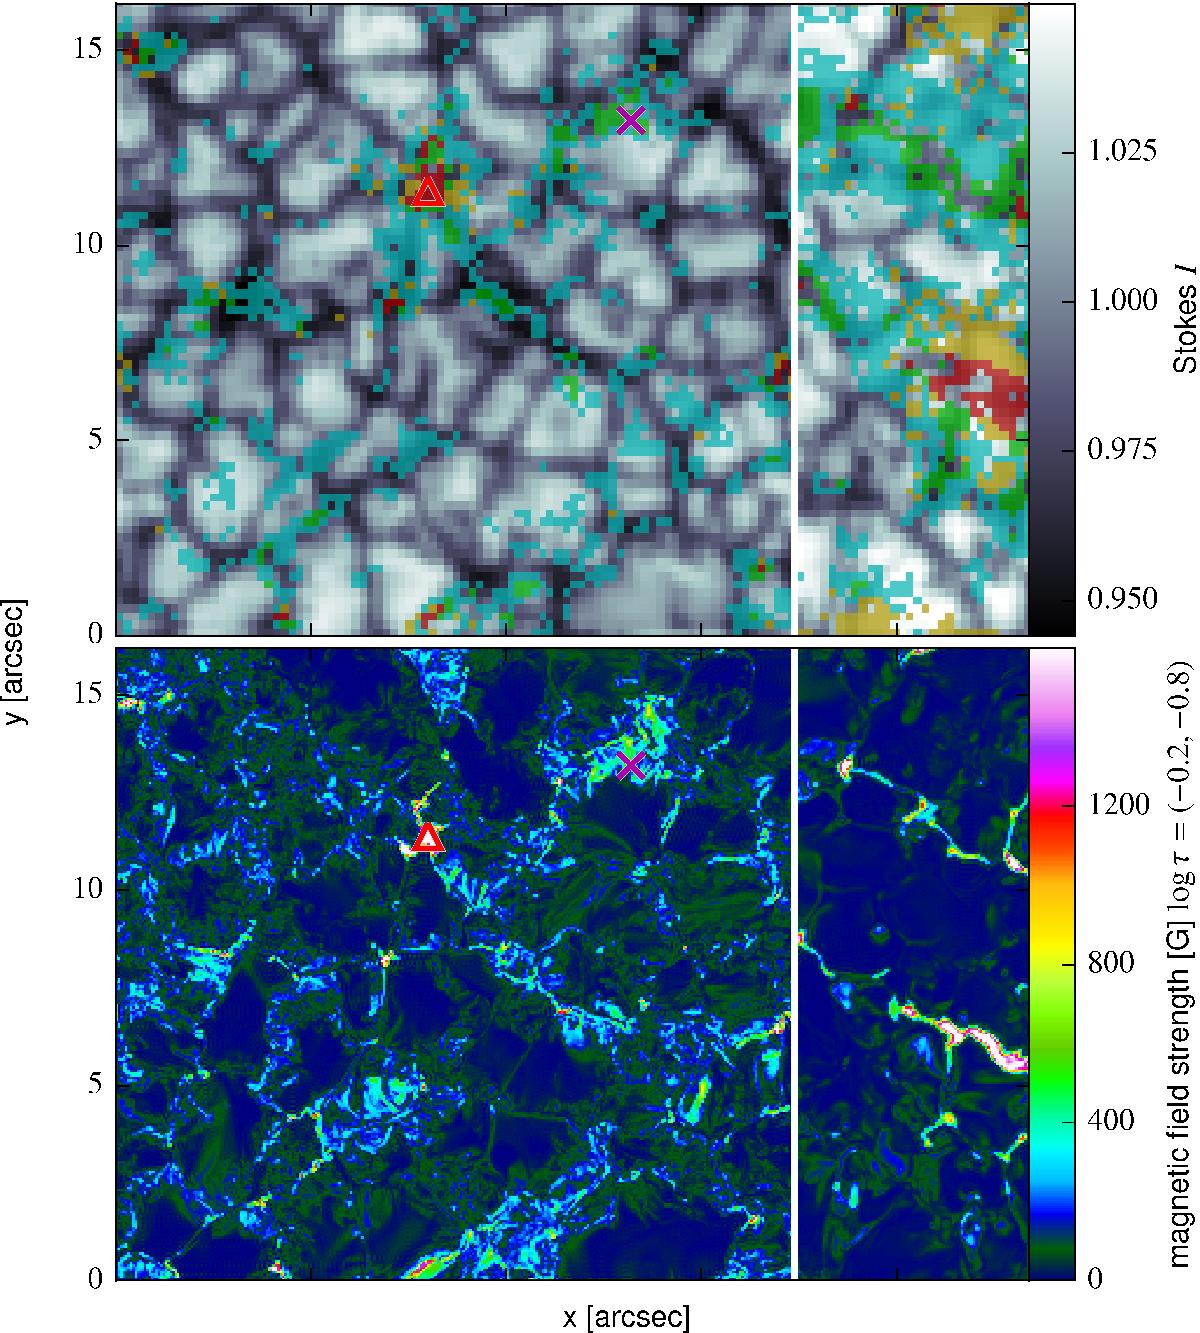
Continuum intensity map of the MHD data (top, degraded to GRIS resolution) and magnetic field strength map (bottom, original MHD resolution) of the small-scale dynamo run (MHD/SSD, left three quarters of the map) and the MHD/IMaX run (right quarter), separated by the white line. The color coding in the I map (top) indicates the regions with specific ranges for Vmax and MLR indicated in Fig. 11. The triangle and cross show the positions of the Stokes profiles presented in Figs. 9 and 10.
Current usage metrics show cumulative count of Article Views (full-text article views including HTML views, PDF and ePub downloads, according to the available data) and Abstracts Views on Vision4Press platform.
Data correspond to usage on the plateform after 2015. The current usage metrics is available 48-96 hours after online publication and is updated daily on week days.
Initial download of the metrics may take a while.