Fig. 1
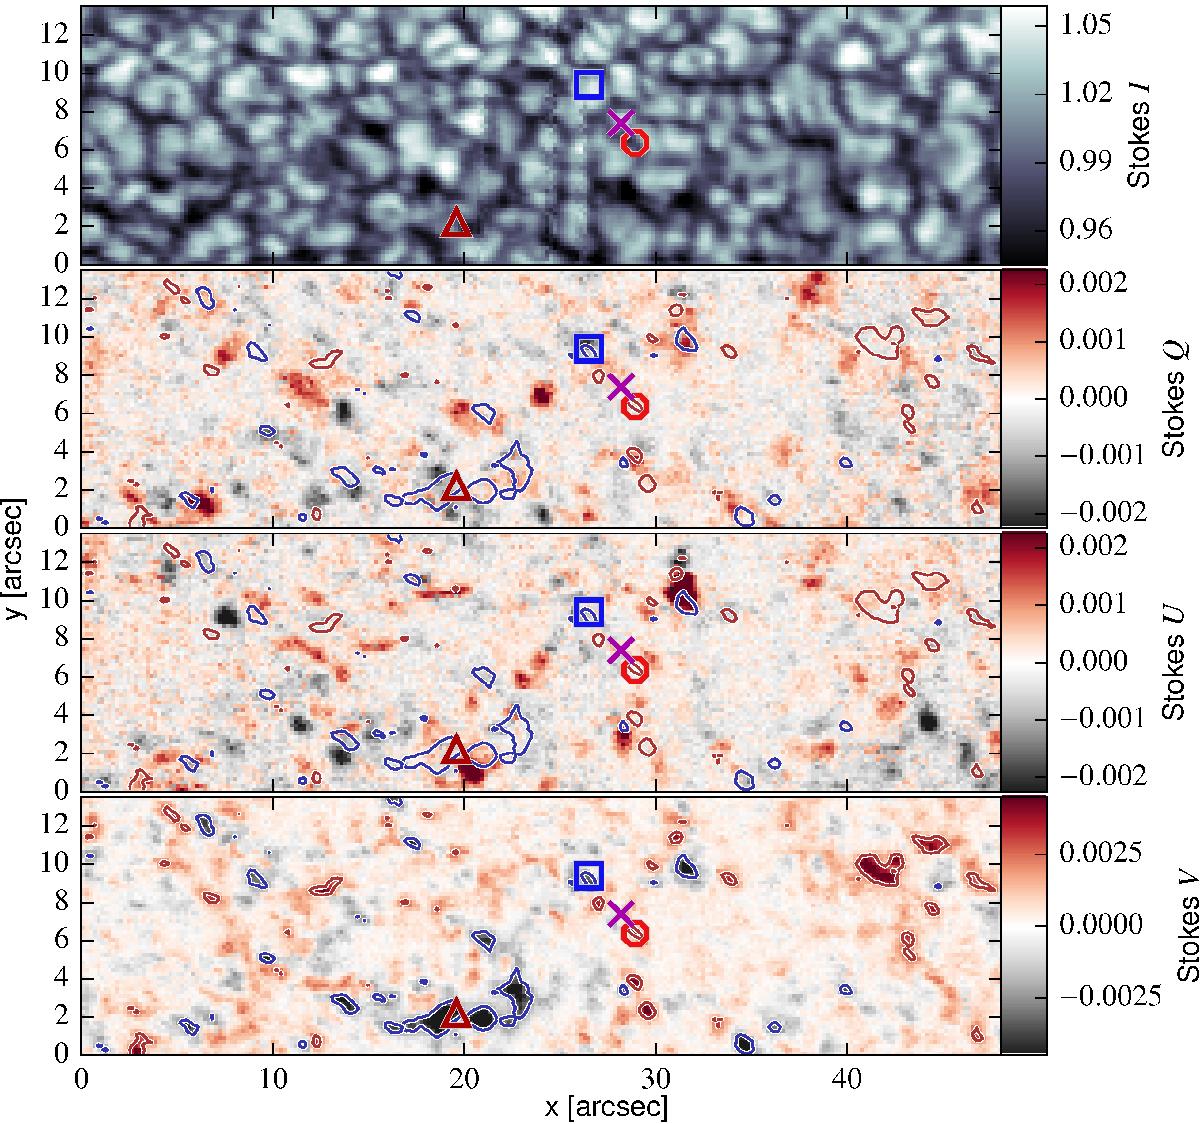
Stokes maps assembled from the GRIS scan of the quiet-Sun region at the disk center. The top panel shows the continuum intensity at 1.56 μm, the Q, U, and V maps are averages over a 0.75 Å wide spectral window using the nominal wavelength of the Fe i 15 648.5 Å line as the central position for Q and U, and as the lower limit for V. The abscissa x is the slit direction, the ordinate y is the scan direction. The blue and red contours mark the Stokes V levels with | V | = 0.002. The symbols mark the location of sample profiles, shown later in Figs. 2, 9, and 10. The contours outline a Stokes V value of ±0.0025.
Current usage metrics show cumulative count of Article Views (full-text article views including HTML views, PDF and ePub downloads, according to the available data) and Abstracts Views on Vision4Press platform.
Data correspond to usage on the plateform after 2015. The current usage metrics is available 48-96 hours after online publication and is updated daily on week days.
Initial download of the metrics may take a while.