Fig. 4
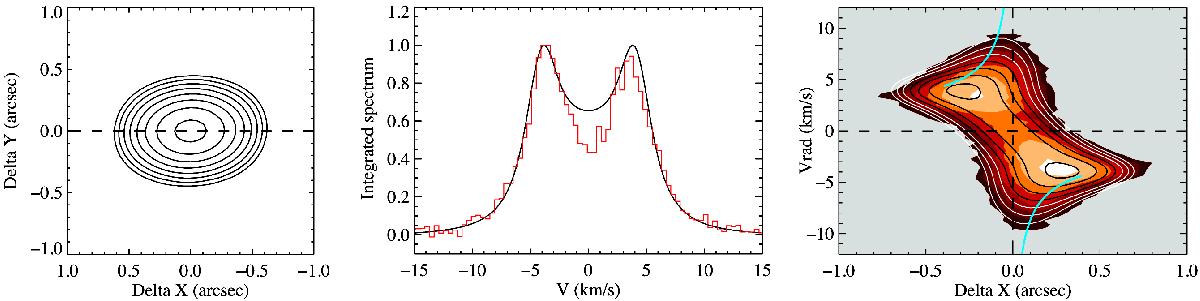
Predictions of the 12CO emission for flat, optically thick disks viewed at 80° inclination. The model corresponds to a solution with Rout = 92.5 au, M⋆ = 1.6 M⊙. The model was convolved with a beam of 0.46′′ by 0.37′′ with a PA = 88°. Left panel: predicted 12CO integrated intensity map; middle panel: 12CO integrated spectra (data en red and model in black); right panel: predicted position-velocity diagram along the disk PA (black and white contours) overlaid on observations (background color map). The blue curve shows the theoretical projected Keplerian velocity profile. In all maps, contours start at 90% of the peak and decrease by ![]() .
.
Current usage metrics show cumulative count of Article Views (full-text article views including HTML views, PDF and ePub downloads, according to the available data) and Abstracts Views on Vision4Press platform.
Data correspond to usage on the plateform after 2015. The current usage metrics is available 48-96 hours after online publication and is updated daily on week days.
Initial download of the metrics may take a while.