Fig. 3
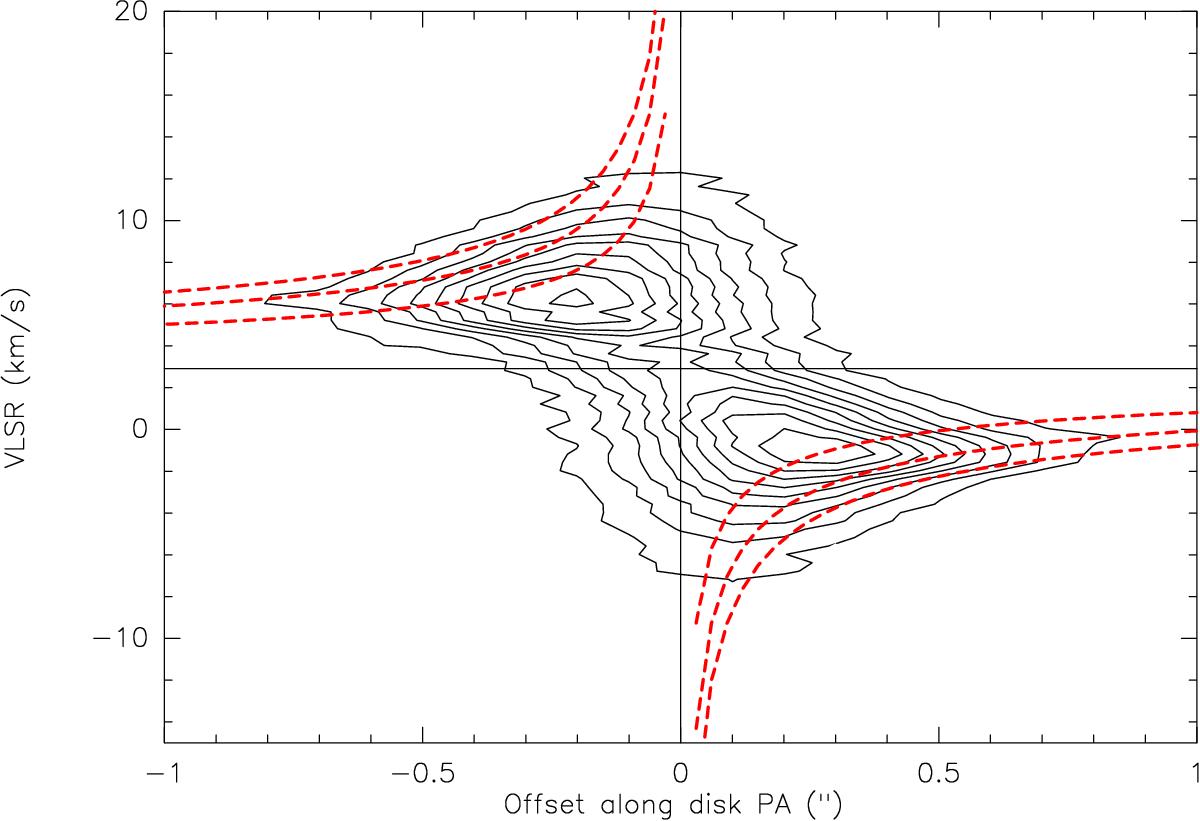
PV diagram of the 12CO emission along the disk PA (see black arrow in Fig. 2, bottom left). Contour star at 32 mJy/beam with 32 mJy/beam steps. The plot is superimposed with expected Keplerian motions in a disk inclined by 80° for a central object of 1, 2, and 3 M⊙ (internal, central, and external curves respectively).
Current usage metrics show cumulative count of Article Views (full-text article views including HTML views, PDF and ePub downloads, according to the available data) and Abstracts Views on Vision4Press platform.
Data correspond to usage on the plateform after 2015. The current usage metrics is available 48-96 hours after online publication and is updated daily on week days.
Initial download of the metrics may take a while.