Fig. 2
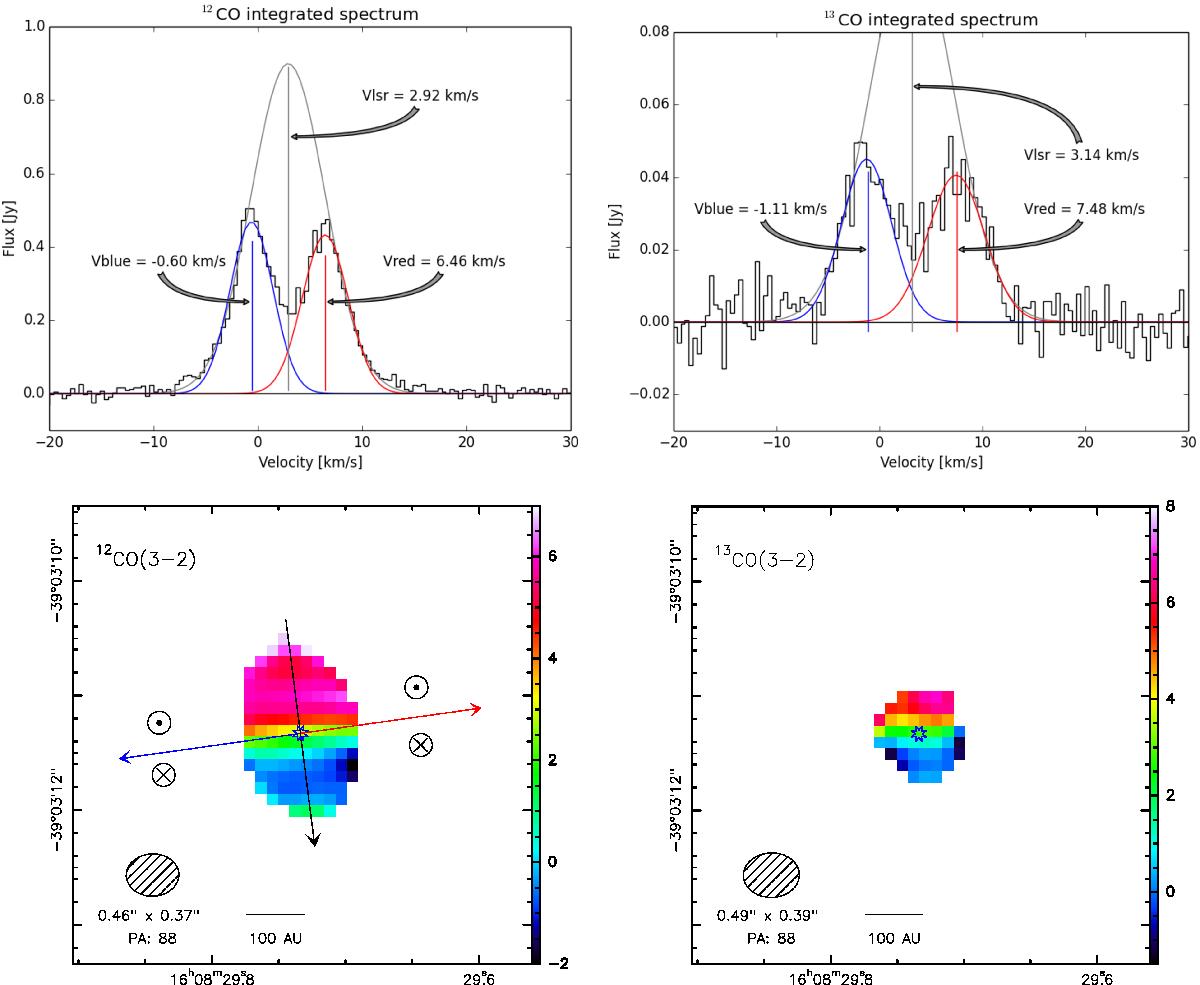
Top left: integrated spectra of the 12CO(3−2) emission line. Top right: integrated spectra of the 13CO(3−2) emission line. The integration surfaces correspond to areas where emission is above 5σ on the corresponding integrated maps presented in Fig. 1. Bottom left: first moment of the 12CO(3−2) emission line. The black arrow indicates the PA of the disk as seen in 12CO. The latter is used to build the PV diagram shown in Fig. 3. The red and blue arrows represent the jet axis of Th 28, while the line-of-sight vectors represent their rotation sense in optical tracers derived by Coffey et al. (2004). Bottom right: first moment of the 13CO(3−2) emission line. In these two first-moment maps, a clear velocity gradient due to the rotation of the circumstellar disk of Th 28 is seen.
Current usage metrics show cumulative count of Article Views (full-text article views including HTML views, PDF and ePub downloads, according to the available data) and Abstracts Views on Vision4Press platform.
Data correspond to usage on the plateform after 2015. The current usage metrics is available 48-96 hours after online publication and is updated daily on week days.
Initial download of the metrics may take a while.