Fig. 1
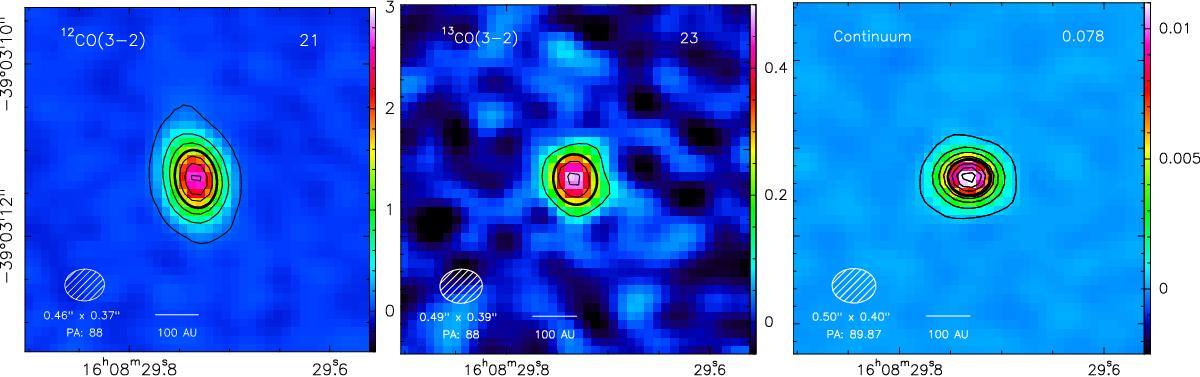
Left: moment zero of the 12CO(3−2) integrated from −15 to 20 km s-1. Contours start at 5σ with 20σ steps. Middle: moment zero of the 13CO(3−2) integrated from −15 to 20 km s-1. Contours start at 5σ with 5σ steps. Right: continuum map. Contours start at 5σ with 20σ steps. Noise level at 1σ is indicated in the upper right corner of each panel; the unit is mJy/beam km s-1 in the two left panels and mJy/beam in the right panel. The black ellipses on the three panels represent the FWHM intensity contours. White hatched ellipses represent the clean beam FWHM.
Current usage metrics show cumulative count of Article Views (full-text article views including HTML views, PDF and ePub downloads, according to the available data) and Abstracts Views on Vision4Press platform.
Data correspond to usage on the plateform after 2015. The current usage metrics is available 48-96 hours after online publication and is updated daily on week days.
Initial download of the metrics may take a while.