Fig. 9
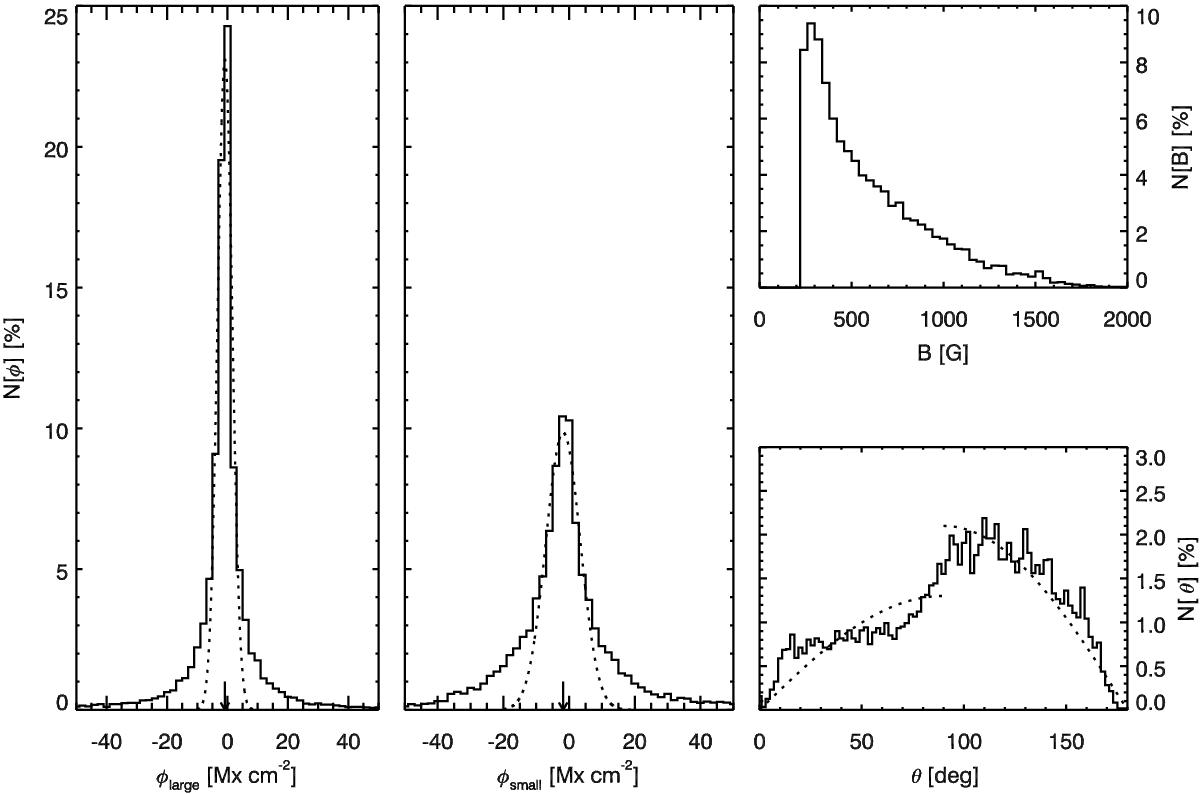
Left panel: histogram of the magnetic flux density inferred for the large component. Middle panel: histogram of the magnetic flux density of the small component for those pixels with fields strengths below 250 G. The vertical arrow marks the average value of the fitted Gaussian core (dotted line). The top and bottom right panels display the magnetic field strength and inclination of the small component for field strengths above 250 G.
Current usage metrics show cumulative count of Article Views (full-text article views including HTML views, PDF and ePub downloads, according to the available data) and Abstracts Views on Vision4Press platform.
Data correspond to usage on the plateform after 2015. The current usage metrics is available 48-96 hours after online publication and is updated daily on week days.
Initial download of the metrics may take a while.