Fig. 8
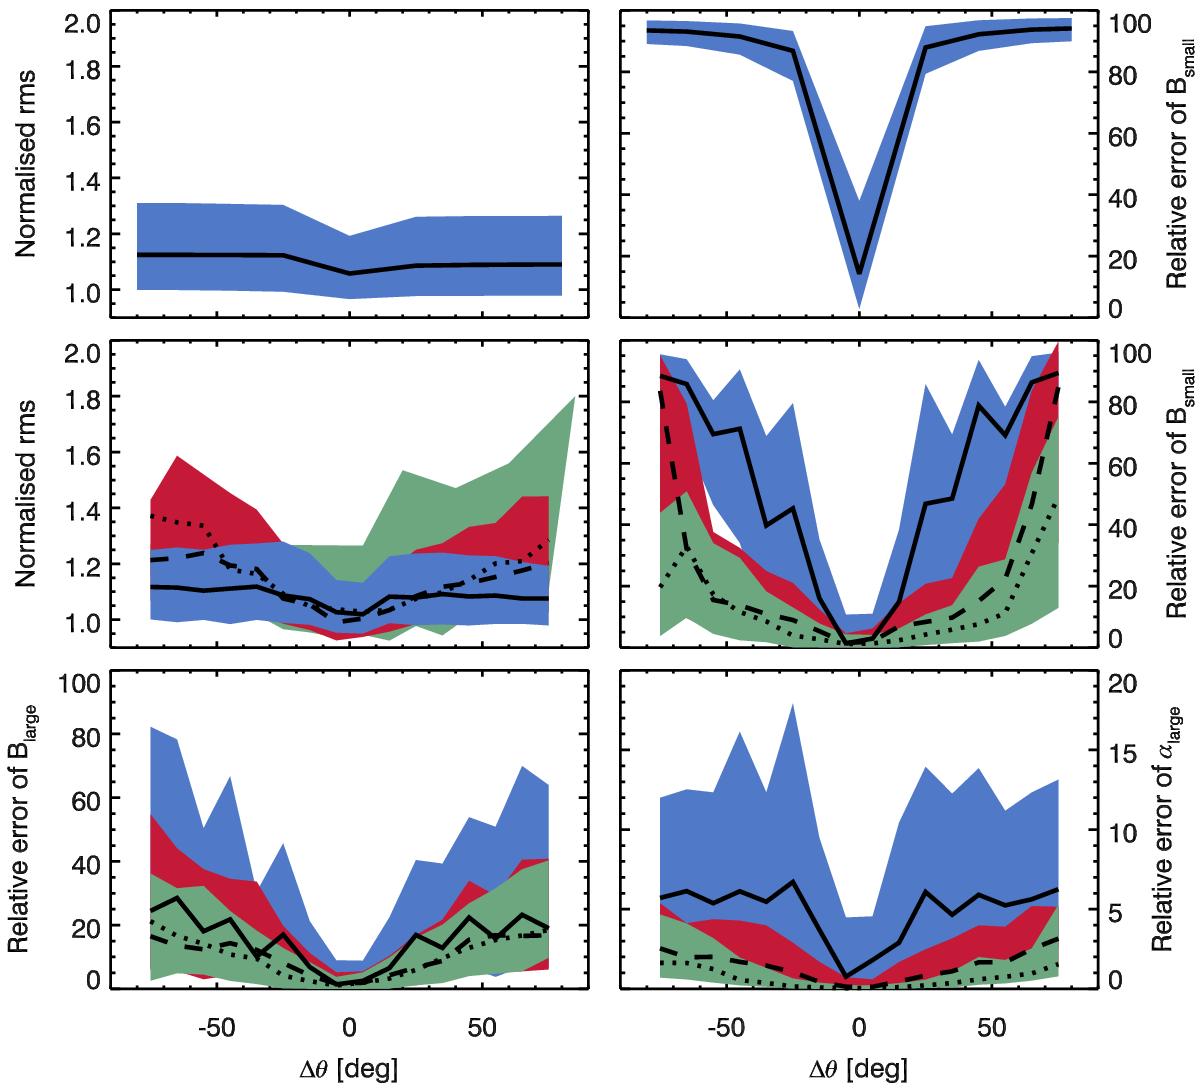
Top panels: results of the numerical test to check the validity of the inferred magnetic properties of the large component. The top left panel represents the the normalised rms of the polarisation profiles defined as ∑ S = QUVσ(Sfit−Sobs)/3σn plotted versus the inclination we have forced in each inversion. The top right panel shows the relative modification of the magnetic field strength of the large component to account for the forced values of the inclination. The black line represents the 50 percentile (median value), and the shaded blue areas enclose percentiles 25 to 75. The remaining panels show the numerical test to check the reliability of the small component. The middle left panel represents the normalised rms of the polarisation profiles for the weak population (solid line for the median and blue shaded areas for percentiles 25 to 75), the strong population (dashed line and red shaded areas), and the very strong population (dotted line and green shaded areas). The middle and bottom right panels show the relative modification of the magnetic field strength of the small component and the filling factor to account for the forced values of the inclination.
Current usage metrics show cumulative count of Article Views (full-text article views including HTML views, PDF and ePub downloads, according to the available data) and Abstracts Views on Vision4Press platform.
Data correspond to usage on the plateform after 2015. The current usage metrics is available 48-96 hours after online publication and is updated daily on week days.
Initial download of the metrics may take a while.