Fig. 7
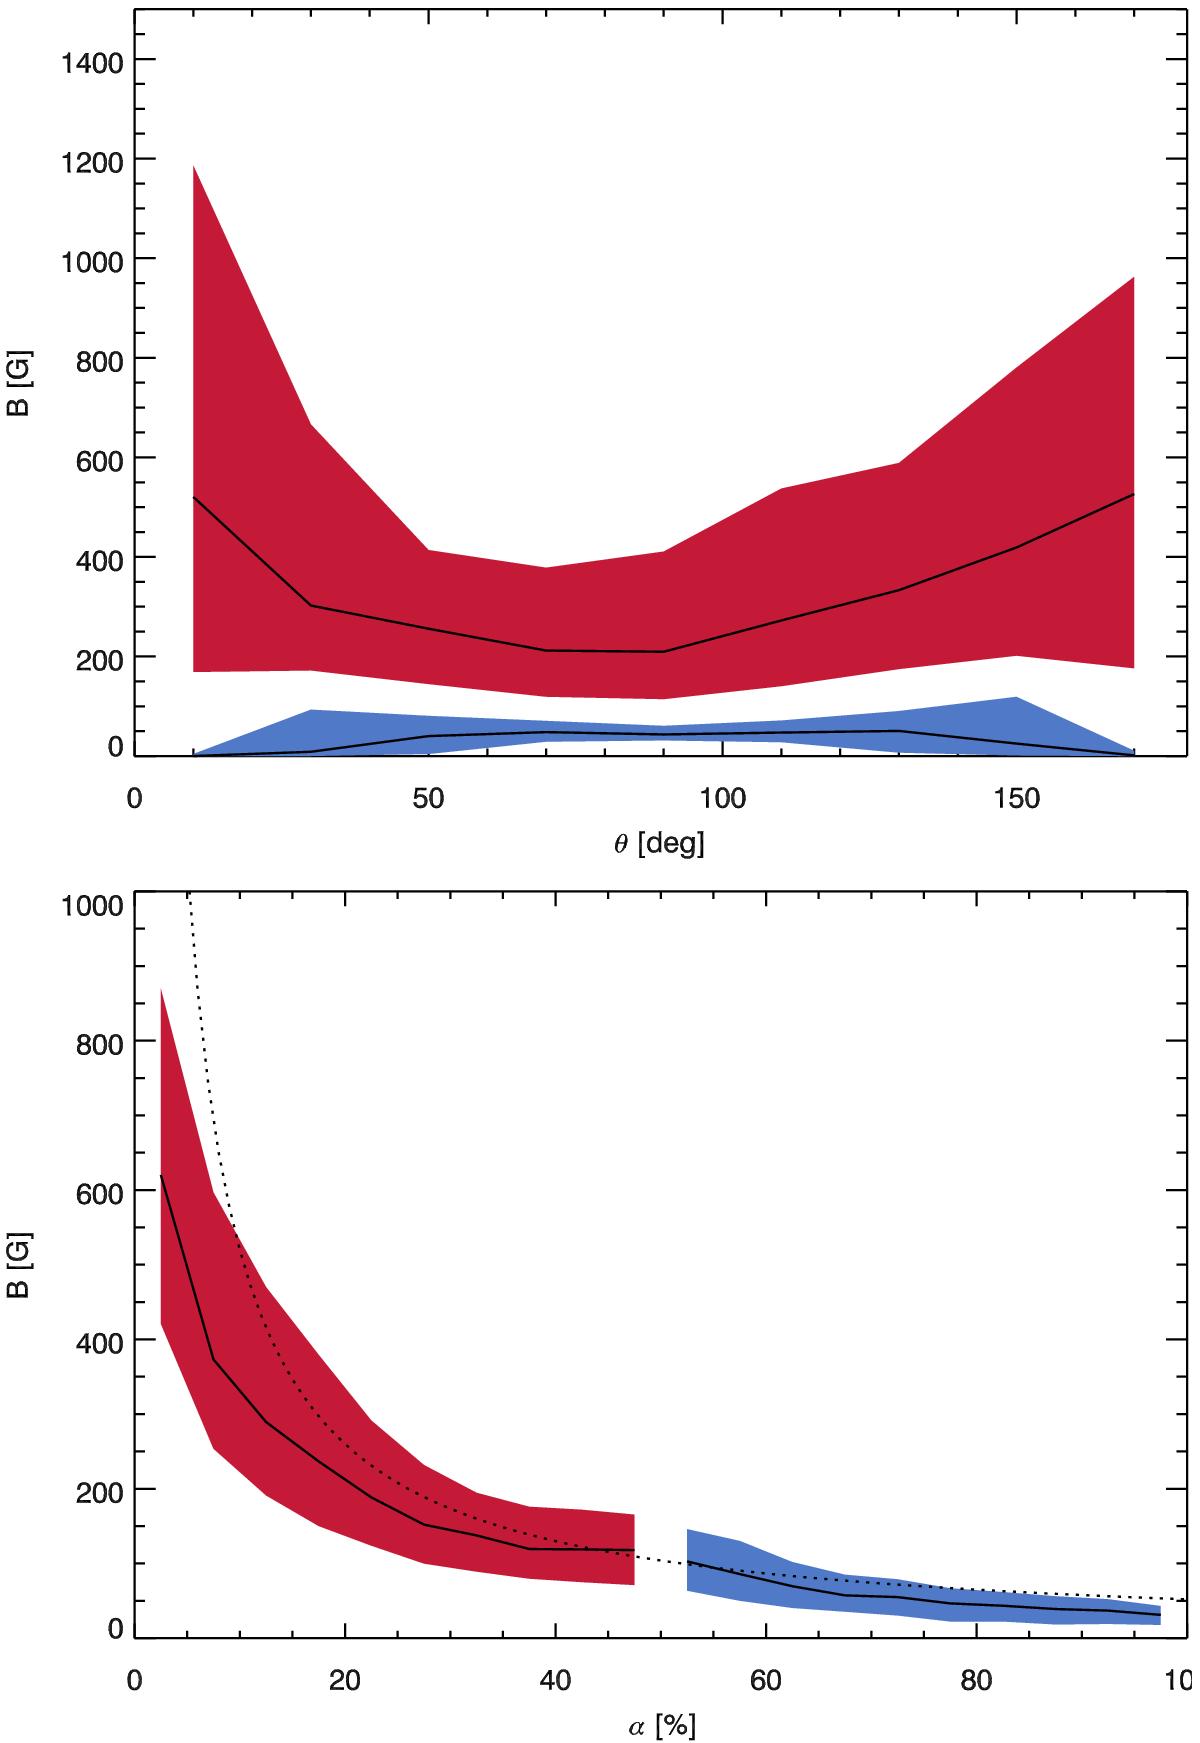
Magnetic field strength versus inclination (top) and versus filling factor (bottom). All the inverted pixels have Stokes Q or U or V signals above 4σn. Blue (red) represents the large (small) component, the one with larger (smaller) filling factor. The black line represents the median value, and the shaded areas enclose percentiles 25 to 75. The dotted black line is an hyperbolic relationship given by 5200/α[%].
Current usage metrics show cumulative count of Article Views (full-text article views including HTML views, PDF and ePub downloads, according to the available data) and Abstracts Views on Vision4Press platform.
Data correspond to usage on the plateform after 2015. The current usage metrics is available 48-96 hours after online publication and is updated daily on week days.
Initial download of the metrics may take a while.