Fig. 6
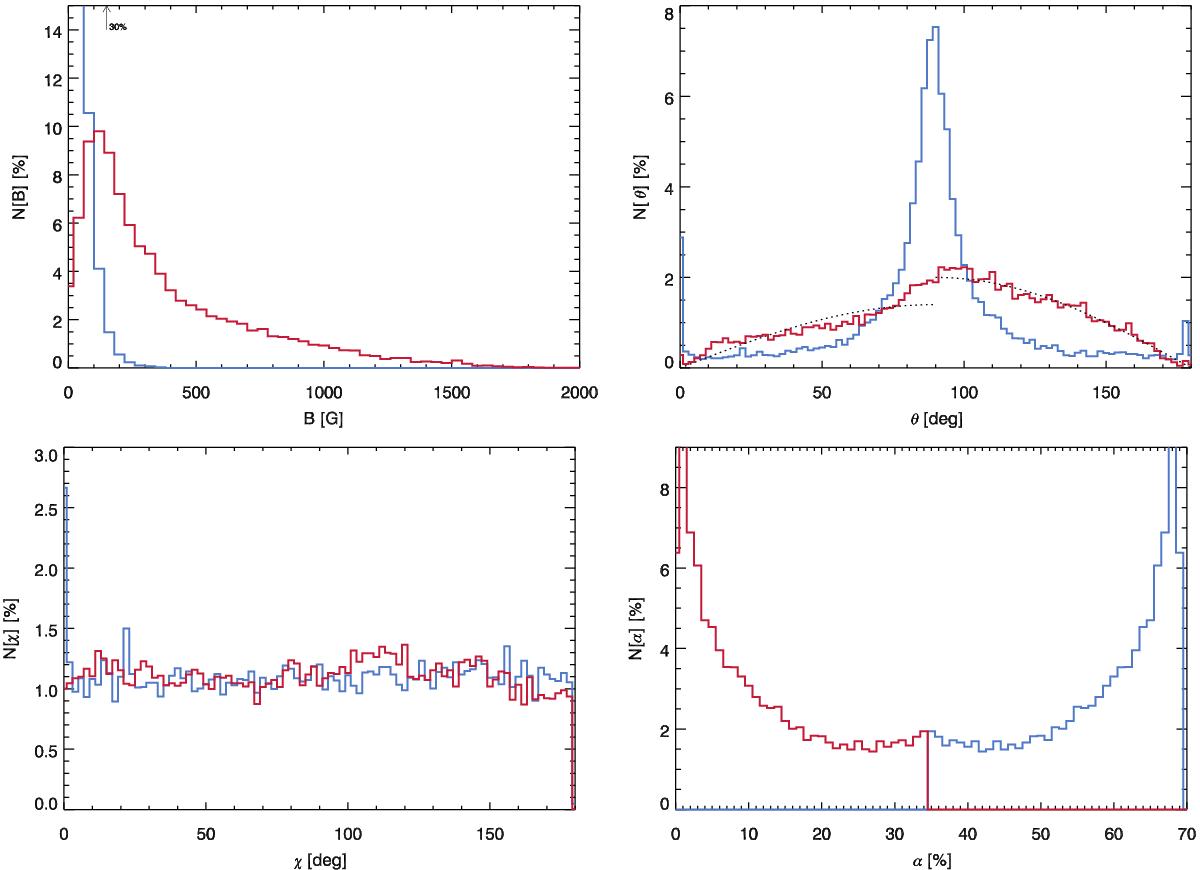
Histograms of the inferred field vector (strength, inclination, and azimuth) and the filling factors using a model with two magnetic atmospheres contaminated by 30% of unpolarised stray light. All the inverted pixels have Stokes Q or U or V signals above 4σn and have better fits than the single magnetic component inversion. The blue (red) lines represent the large (small) component, the one with larger (smaller) filling factor. The dotted grey lines superposed to the inclination histogram represent a sinθ distribution. Taking into account that the azimuth is uniform, these dotted lines represent an isotropic distribution of the field vector.
Current usage metrics show cumulative count of Article Views (full-text article views including HTML views, PDF and ePub downloads, according to the available data) and Abstracts Views on Vision4Press platform.
Data correspond to usage on the plateform after 2015. The current usage metrics is available 48-96 hours after online publication and is updated daily on week days.
Initial download of the metrics may take a while.